
Page 471 - The Principle of Economics
P. 471
Consumption
Wage
CHAPTER 21 THE THEORY OF CONSUMER CHOICE 481
(a) For a person with these preferences . . .
. . . the labor supply curve slopes upward.
BC1
1. When the wage rises . . .
BC2 I2 I1
Labor supply
0
Consumption
Hours of Leisure
0 Hours of Labor
2. . . . hours of leisure decrease . . .
3. . . . and hours of labor increase.
Supplied
(b) For a person with these preferences . . .
. . . the labor supply curve slopes backward.
BC2
BC1
1. When the wage rises . . .
I2 I1
Labor supply
Wage
0
Hours of Leisure
0 Hours of Labor
2. . . . hours of leisure increase . . .
3. . . . and hours of labor decrease.
Supplied
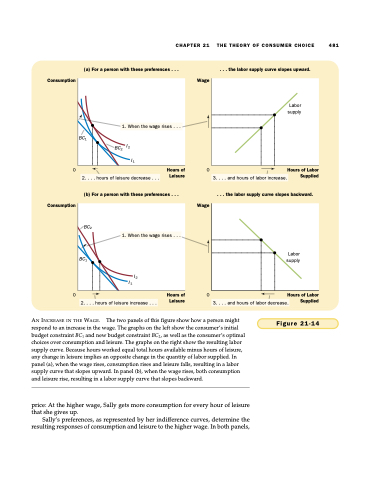
AN INCREASE IN THE WAGE. The two panels of this figure show how a person might respond to an increase in the wage. The graphs on the left show the consumer’s initial budget constraint BC1 and new budget constraint BC2, as well as the consumer’s optimal choices over consumption and leisure. The graphs on the right show the resulting labor supply curve. Because hours worked equal total hours available minus hours of leisure, any change in leisure implies an opposite change in the quantity of labor supplied. In panel (a), when the wage rises, consumption rises and leisure falls, resulting in a labor supply curve that slopes upward. In panel (b), when the wage rises, both consumption and leisure rise, resulting in a labor supply curve that slopes backward.
price: At the higher wage, Sally gets more consumption for every hour of leisure that she gives up.
Sally’s preferences, as represented by her indifference curves, determine the resulting responses of consumption and leisure to the higher wage. In both panels,
Figure 21-14
