
Page 489 - The Principle of Economics
P. 489
CHAPTER 22 MEASURING A NATION’S INCOME 501
PRICES AND QUANTITIES
YEAR PRICEOFHOTDOGS QUANTITYOFHOTDOGS PRICEOFHAMBURGERS QUANTITYOFHAMBURGERS
2001 $1 100 $2 50 2002 2 150 3 100 2003 3 200 4 150
CALCULATING NOMINAL GDP
($1 per hot dog 100 hot dogs) ($2 per hamburger 50 hamburgers) $200 ($2 per hot dog 150 hot dogs) ($3 per hamburger 100 hamburgers) $600 ($3 per hot dog 200 hot dogs) ($4 per hamburger 150 hamburgers) $1,200
CALCULATING REAL GDP (BASE YEAR 2001)
($1 per hot dog 100 hot dogs) ($2 per hamburger 50 hamburgers) $200 ($1 per hot dog 150 hot dogs) ($2 per hamburger 100 hamburgers) $350 ($1 per hot dog 200 hot dogs) ($2 per hamburger 150 hamburgers) $500
YEAR
2001
2002
2003
YEAR
2001
2002
2003
YEAR
2001
2002
2003
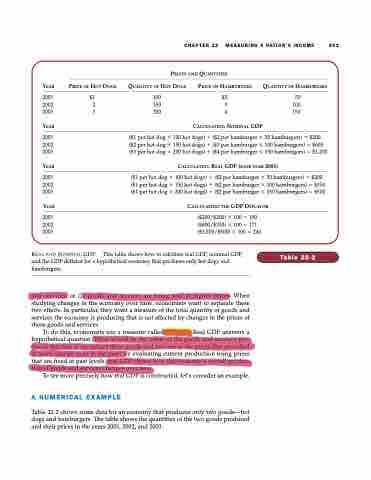
REAL AND NOMINAL GDP.
and the GDP deflator for a hypothetical economy that produces only hot dogs and hamburgers.
and services, or (2) goods and services are being sold at higher prices. When studying changes in the economy over time, economists want to separate these two effects. In particular, they want a measure of the total quantity of goods and services the economy is producing that is not affected by changes in the prices of those goods and services.
To do this, economists use a measure called real GDP. Real GDP answers a hypothetical question: What would be the value of the goods and services pro- duced this year if we valued these goods and services at the prices that prevailed in some specific year in the past? By evaluating current production using prices that are fixed at past levels, real GDP shows how the economy’s overall produc- tion of goods and services changes over time.
To see more precisely how real GDP is constructed, let’s consider an example.
A NUMERICAL EXAMPLE
Table 22-2 shows some data for an economy that produces only two goods—hot dogs and hamburgers. The table shows the quantities of the two goods produced and their prices in the years 2001, 2002, and 2003.
This table shows how to calculate real GDP, nominal GDP,
Table 22-2
CALCULATING THE GDP DEFLATOR
($200/$200) 100 100 ($600/$350) 100 171 ($1,200/$500) 100 240
