
Page 491 - The Principle of Economics
P. 491
The GDP deflator is calculated as follows:
GDP deflator Nominal GDP 100.
Real GDP
Because nominal GDP and real GDP must be the same in the base year, the GDP deflator for the base year always equals 100. The GDP deflator for subsequent years measures the rise in nominal GDP from the base year that cannot be attrib- utable to a rise in real GDP.
The GDP deflator measures the current level of prices relative to the level of prices in the base year. To see why this is true, consider a couple of simple exam- ples. First, imagine that the quantities produced in the economy rise over time but prices remain the same. In this case, both nominal and real GDP rise together, so the GDP deflator is constant. Now suppose, instead, that prices rise over time but the quantities produced stay the same. In this second case, nominal GDP rises but real GDP remains the same, so the GDP deflator rises as well. Notice that, in both cases, the GDP deflator reflects what’s happening to prices, not quantities.
Let’s now return to our numerical example in Table 22-2. The GDP deflator is computed at the bottom of the table. For year 2001, nominal GDP is $200, and real GDP is $200, so the GDP deflator is 100. For the year 2002, nominal GDP is $600, and real GDP is $350, so the GDP deflator is 171. Because the GDP deflator rose in year 2002 from 100 to 171, we can say that the price level increased by 71 percent.
The GDP deflator is one measure that economists use to monitor the average level of prices in the economy. We examine another—the consumer price index—in the next chapter, where we also describe the differences between the two measures.
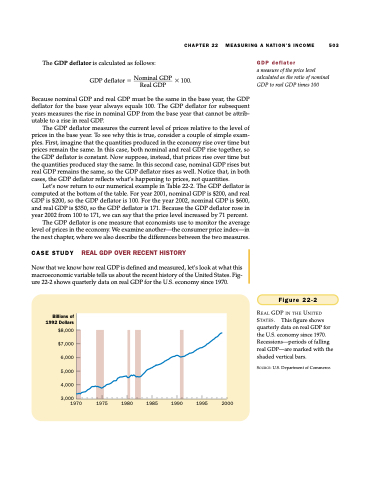
CASE STUDY REAL GDP OVER RECENT HISTORY
Now that we know how real GDP is defined and measured, let’s look at what this macroeconomic variable tells us about the recent history of the United States. Fig- ure 22-2 shows quarterly data on real GDP for the U.S. economy since 1970.
GDP deflator
a measure of the price level calculated as the ratio of nominal GDP to real GDP times 100
CHAPTER 22
MEASURING A NATION’S INCOME 503
Billions of 1992 Dollars
$8,000 $7,000 6,000 5,000 4,000
3,000
1970 1975
Figure 22-2
REAL GDP IN THE UNITED STATES. This figure shows quarterly data on real GDP for the U.S. economy since 1970. Recessions—periods of falling real GDP—are marked with the shaded vertical bars.
SOURCE: U.S. Department of Commerce.
1980 1985 1990 1995 2000
