
Page 615 - The Principle of Economics
P. 615
CHAPTER 28 MONEY GROWTH AND INFLATION 631
Money supply
A
Money demand
Value of Price Money, 1/P Level, P
(High) 1 1 (Low)
3/4 1.33
1/2 2
1/4 4
(Low) 0 (High) Quantity fixed Quantity of
by the Fed Money
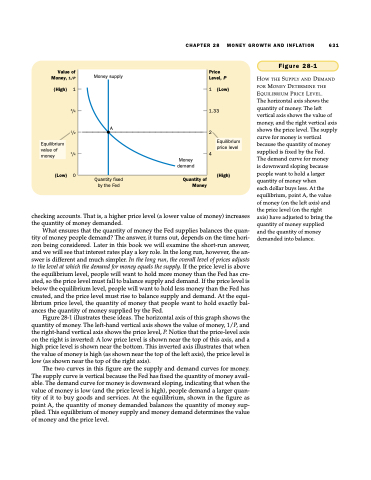
Figure 28-1
HOW THE SUPPLY AND DEMAND FOR MONEY DETERMINE THE EQUILIBRIUM PRICE LEVEL.
The horizontal axis shows the quantity of money. The left vertical axis shows the value of money, and the right vertical axis shows the price level. The supply curve for money is vertical because the quantity of money supplied is fixed by the Fed.
The demand curve for money is downward sloping because people want to hold a larger quantity of money when
each dollar buys less. At the equilibrium, point A, the value
Equilibrium price level
Equilibrium value of money
checking accounts. That is, a higher price level (a lower value of money) increases the quantity of money demanded.
What ensures that the quantity of money the Fed supplies balances the quan- tity of money people demand? The answer, it turns out, depends on the time hori- zon being considered. Later in this book we will examine the short-run answer, and we will see that interest rates play a key role. In the long run, however, the an- swer is different and much simpler. In the long run, the overall level of prices adjusts to the level at which the demand for money equals the supply. If the price level is above the equilibrium level, people will want to hold more money than the Fed has cre- ated, so the price level must fall to balance supply and demand. If the price level is below the equilibrium level, people will want to hold less money than the Fed has created, and the price level must rise to balance supply and demand. At the equi- librium price level, the quantity of money that people want to hold exactly bal- ances the quantity of money supplied by the Fed.
Figure 28-1 illustrates these ideas. The horizontal axis of this graph shows the quantity of money. The left-hand vertical axis shows the value of money, 1/P, and the right-hand vertical axis shows the price level, P. Notice that the price-level axis on the right is inverted: A low price level is shown near the top of this axis, and a high price level is shown near the bottom. This inverted axis illustrates that when the value of money is high (as shown near the top of the left axis), the price level is low (as shown near the top of the right axis).
The two curves in this figure are the supply and demand curves for money. The supply curve is vertical because the Fed has fixed the quantity of money avail- able. The demand curve for money is downward sloping, indicating that when the value of money is low (and the price level is high), people demand a larger quan- tity of it to buy goods and services. At the equilibrium, shown in the figure as point A, the quantity of money demanded balances the quantity of money sup- plied. This equilibrium of money supply and money demand determines the value of money and the price level.
of money (on the left axis) and the price level (on the right axis) have adjusted to bring the quantity of money supplied and the quantity of money demanded into balance.
