
Page 616 - The Principle of Economics
P. 616
632 PART TEN
MONEY AND PRICES IN THE LONG RUN
quantity theory of money
a theory asserting that the quantity of money available determines the price level and that the growth rate in the quantity of money available determines the inflation rate
THE EFFECTS OF A MONETARY INJECTION
Let’s now consider the effects of a change in monetary policy. To do so, imagine that the economy is in equilibrium and then, suddenly, the Fed doubles the supply of money by printing some dollar bills and dropping them around the country from helicopters. (Or, less dramatically and more realistically, the Fed could inject money into the economy by buying some government bonds from the public in open-market operations.) What happens after such a monetary injection? How does the new equilibrium compare to the old one?
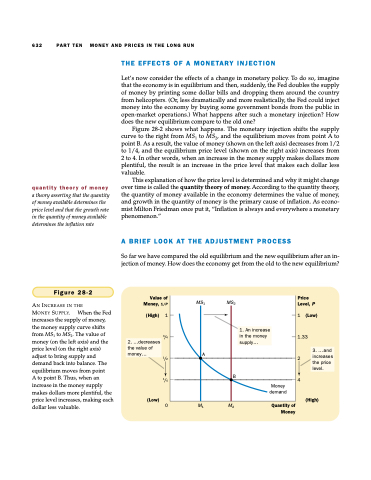
Figure 28-2 shows what happens. The monetary injection shifts the supply curve to the right from MS1 to MS2, and the equilibrium moves from point A to point B. As a result, the value of money (shown on the left axis) decreases from 1/2 to 1/4, and the equilibrium price level (shown on the right axis) increases from 2 to 4. In other words, when an increase in the money supply makes dollars more plentiful, the result is an increase in the price level that makes each dollar less valuable.
This explanation of how the price level is determined and why it might change over time is called the quantity theory of money. According to the quantity theory, the quantity of money available in the economy determines the value of money, and growth in the quantity of money is the primary cause of inflation. As econo- mist Milton Friedman once put it, “Inflation is always and everywhere a monetary phenomenon.”
A BRIEF LOOK AT THE ADJUSTMENT PROCESS
So far we have compared the old equilibrium and the new equilibrium after an in- jection of money. How does the economy get from the old to the new equilibrium?
Figure 28-2
AN INCREASE IN THE
MONEY SUPPLY. When the Fed increases the supply of money, the money supply curve shifts from MS1 to MS2. The value of money (on the left axis) and the price level (on the right axis) adjust to bring supply and demand back into balance. The equilibrium moves from point
A to point B. Thus, when an increase in the money supply makes dollars more plentiful, the price level increases, making each
Value of Money, 1/P
(High) 1
3/4
1/2
1/4
Price Level, P
1 (Low)
1.33
2
4
2. ...decreases the value of money ...
(Low)
(High)
3. ...and increases the price level.
MS1 MS2
A
1. An increase in the money supply...
B
Money demand
dollar less valuable.
0 M M Quantity of 12
Money
