
Page 691 - The Principle of Economics
P. 691
the left. When Europe recovers from its recession, it starts buying U.S. goods again, shifting the aggregate-demand curve to the right.
Net exports sometimes change because of movements in the exchange rate. Suppose, for instance, that international speculators bid up the value of the U.S. dollar in the market for foreign-currency exchange. This appreciation of the dollar would make U.S. goods more expensive compared to foreign goods, which would depress net exports and shift the aggregate-demand curve to the left. Conversely, a depreciation of the dollar stimulates net exports and shifts the aggregate- demand curve to the right.
Summary In the next chapter we analyze the aggregate-demand curve in more detail. There we examine more precisely how the tools of monetary and fis- cal policy can shift aggregate demand and whether policymakers should use these tools for that purpose. At this point, however, you should have some idea about why the aggregate-demand curve slopes downward and what kinds of events and policies can shift this curve. Table 31-1 summarizes what we have learned so far.
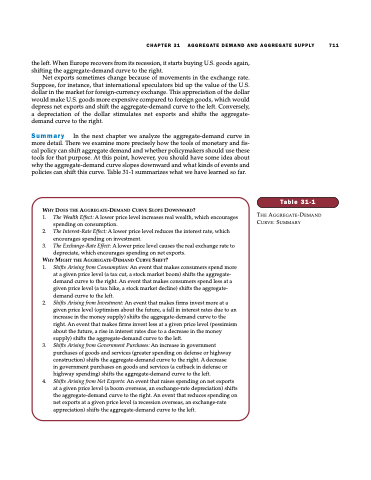
WHY DOES THE AGGREGATE-DEMAND CURVE SLOPE DOWNWARD?
1. The Wealth Effect: A lower price level increases real wealth, which encourages spending on consumption.
2. The Interest-Rate Effect: A lower price level reduces the interest rate, which encourages spending on investment.
3. The Exchange-Rate Effect: A lower price level causes the real exchange rate to depreciate, which encourages spending on net exports.
WHY MIGHT THE AGGREGATE-DEMAND CURVE SHIFT?
1. Shifts Arising from Consumption: An event that makes consumers spend more at a given price level (a tax cut, a stock market boom) shifts the aggregate- demand curve to the right. An event that makes consumers spend less at a given price level (a tax hike, a stock market decline) shifts the aggregate- demand curve to the left.
2. Shifts Arising from Investment: An event that makes firms invest more at a given price level (optimism about the future, a fall in interest rates due to an increase in the money supply) shifts the aggregate-demand curve to the right. An event that makes firms invest less at a given price level (pessimism about the future, a rise in interest rates due to a decrease in the money supply) shifts the aggregate-demand curve to the left.
3. Shifts Arising from Government Purchases: An increase in government purchases of goods and services (greater spending on defense or highway construction) shifts the aggregate-demand curve to the right. A decrease in government purchases on goods and services (a cutback in defense or highway spending) shifts the aggregate-demand curve to the left.
4. Shifts Arising from Net Exports: An event that raises spending on net exports at a given price level (a boom overseas, an exchange-rate depreciation) shifts the aggregate-demand curve to the right. An event that reduces spending on net exports at a given price level (a recession overseas, an exchange-rate appreciation) shifts the aggregate-demand curve to the left.
Table 31-1
THE AGGREGATE-DEMAND CURVE: SUMMARY
CHAPTER 31 AGGREGATE DEMAND AND AGGREGATE SUPPLY 711
