
Page 755 - The Principle of Economics
P. 755
CHAPTER 33 THE SHORT-RUN TRADEOFF BETWEEN INFLATION AND UNEMPLOYMENT 775
however, the economics profession would turn its attention to a different source of shifts in the short-run Phillips curve: shocks to aggregate supply.
This time, the shift in focus came not from two American economics professors but from a group of Arab sheiks. In 1974, the Organization of Petroleum Exporting Countries (OPEC) began to exert its market power as a cartel in the world oil mar- ket in order to increase its members’ profits. The countries of OPEC, such as Saudi Arabia, Kuwait, and Iraq, restricted the amount of crude oil they pumped and sold on world markets. Within a few years, this reduction in supply caused the price of oil to almost double.
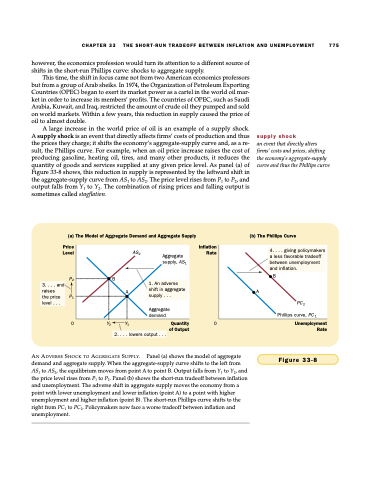
A large increase in the world price of oil is an example of a supply shock. A supply shock is an event that directly affects firms’ costs of production and thus the prices they charge; it shifts the economy’s aggregate-supply curve and, as a re- sult, the Phillips curve. For example, when an oil price increase raises the cost of producing gasoline, heating oil, tires, and many other products, it reduces the quantity of goods and services supplied at any given price level. As panel (a) of Figure 33-8 shows, this reduction in supply is represented by the leftward shift in the aggregate-supply curve from AS1 to AS2. The price level rises from P1 to P2, and output falls from Y1 to Y2. The combination of rising prices and falling output is sometimes called stagflation.
supply shock
an event that directly alters firms’ costs and prices, shifting the economy’s aggregate-supply curve and thus the Phillips curve
(a) The Model of Aggregate Demand and Aggregate Supply
Price Level
P2 P1
0 Y2
(b) The Phillips Curve
AS2
B
A
Aggregate supply, AS1
1. An adverse shift in aggregate supply . . .
Aggregate demand
B A
4. . . . giving policymakers a less favorable tradeoff between unemployment and inflation.
PC2 Phillips curve, PC 1
3. . . . and raises
the price level . . .
Y1
2. . . . lowers output . . .
Inflation Rate
Quantity 0 of Output
Unemployment Rate
Figure 33-8
AN ADVERSE SHOCK TO AGGREGATE SUPPLY. Panel (a) shows the model of aggregate demand and aggregate supply. When the aggregate-supply curve shifts to the left from AS1 to AS2, the equilibrium moves from point A to point B. Output falls from Y1 to Y2, and the price level rises from P1 to P2. Panel (b) shows the short-run tradeoff between inflation and unemployment. The adverse shift in aggregate supply moves the economy from a point with lower unemployment and lower inflation (point A) to a point with higher unemployment and higher inflation (point B). The short-run Phillips curve shifts to the right from PC1 to PC2. Policymakers now face a worse tradeoff between inflation and unemployment.
