
Page 757 - The Principle of Economics
P. 757
CHAPTER 33 THE SHORT-RUN TRADEOFF BETWEEN INFLATION AND UNEMPLOYMENT 777
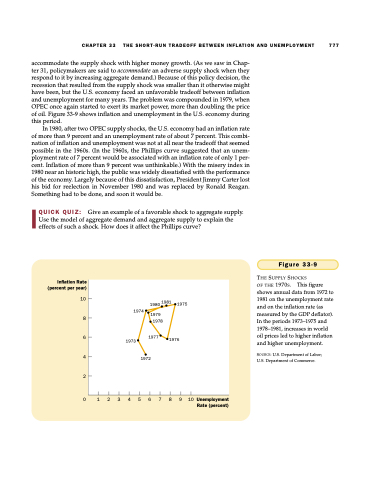
accommodate the supply shock with higher money growth. (As we saw in Chap- ter 31, policymakers are said to accommodate an adverse supply shock when they respond to it by increasing aggregate demand.) Because of this policy decision, the recession that resulted from the supply shock was smaller than it otherwise might have been, but the U.S. economy faced an unfavorable tradeoff between inflation and unemployment for many years. The problem was compounded in 1979, when OPEC once again started to exert its market power, more than doubling the price of oil. Figure 33-9 shows inflation and unemployment in the U.S. economy during this period.
In 1980, after two OPEC supply shocks, the U.S. economy had an inflation rate of more than 9 percent and an unemployment rate of about 7 percent. This combi- nation of inflation and unemployment was not at all near the tradeoff that seemed possible in the 1960s. (In the 1960s, the Phillips curve suggested that an unem- ployment rate of 7 percent would be associated with an inflation rate of only 1 per- cent. Inflation of more than 9 percent was unthinkable.) With the misery index in 1980 near an historic high, the public was widely dissatisfied with the performance of the economy. Largely because of this dissatisfaction, President Jimmy Carter lost his bid for reelection in November 1980 and was replaced by Ronald Reagan. Something had to be done, and soon it would be.
QUICK QUIZ: Give an example of a favorable shock to aggregate supply. Use the model of aggregate demand and aggregate supply to explain the effects of such a shock. How does it affect the Phillips curve?
1973
1980 1981 1975
1974
1979
1978
1977
1976
1972
Inflation Rate (percent per year)
Figure 33-9
THE SUPPLY SHOCKS
OF THE 1970S. This figure shows annual data from 1972 to
10 1981 on the unemployment rate and on the inflation rate (as
8
6
4
2
0 1 2 3 4 5 6 7 8 9 10Unemployment Rate (percent)
measured by the GDP deflator). In the periods 1973–1975 and 1978–1981, increases in world oil prices led to higher inflation and higher unemployment.
SOURCE: U.S. Department of Labor; U.S. Department of Commerce.
