
Page 79 - The Principle of Economics
P. 79
Price of Ice-Cream Cone
$3.00
2.50 2.00 1.50 1.00 0.50
VARIABLES THAT AFFECT
QUANTITYSUPPLIED ACHANGEINTHISVARIABLE...
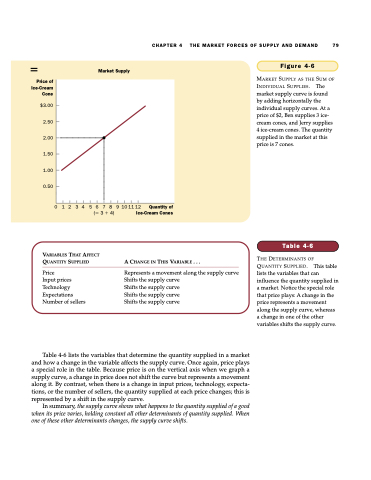
Figure 4-6
MARKET SUPPLY AS THE SUM OF INDIVIDUAL SUPPLIES. The market supply curve is found by adding horizontally the individual supply curves. At a price of $2, Ben supplies 3 ice- cream cones, and Jerry supplies 4 ice-cream cones. The quantity supplied in the market at this price is 7 cones.
Market Supply
CHAPTER 4
THE MARKET FORCES OF SUPPLY AND DEMAND 79
Quantityof ( 3 4) Ice-Cream Cones
0 1 2 3 4 5 6 7 8 9 101112
Price
Input prices Technology Expectations Number of sellers
Represents a movement along the supply curve Shifts the supply curve
Shifts the supply curve
Shifts the supply curve
Shifts the supply curve
Table 4-6
THE DETERMINANTS OF QUANTITY SUPPLIED. This table lists the variables that can influence the quantity supplied in a market. Notice the special role that price plays: A change in the price represents a movement along the supply curve, whereas a change in one of the other variables shifts the supply curve.
Table 4-6 lists the variables that determine the quantity supplied in a market and how a change in the variable affects the supply curve. Once again, price plays a special role in the table. Because price is on the vertical axis when we graph a supply curve, a change in price does not shift the curve but represents a movement along it. By contrast, when there is a change in input prices, technology, expecta- tions, or the number of sellers, the quantity supplied at each price changes; this is represented by a shift in the supply curve.
In summary, the supply curve shows what happens to the quantity supplied of a good when its price varies, holding constant all other determinants of quantity supplied. When one of these other determinants changes, the supply curve shifts.
