
Page 84 - The Principle of Economics
P. 84
84 PART TWO
SUPPLY AND DEMAND I: HOW MARKETS WORK
Figure 4-10
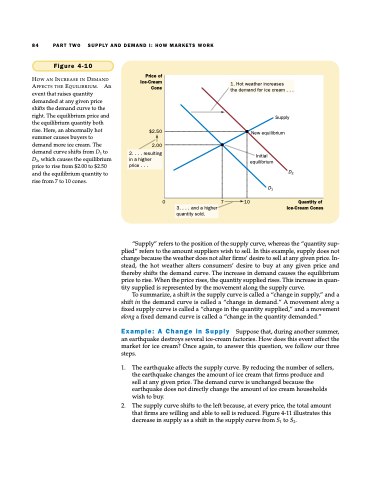
HOW AN INCREASE IN DEMAND
AFFECTS THE EQUILIBRIUM. An
event that raises quantity
demanded at any given price
shifts the demand curve to the
right. The equilibrium price and
the equilibrium quantity both
rise. Here, an abnormally hot
summer causes buyers to
demand more ice cream. The 2.00 demand curve shifts from D1 to
D2, which causes the equilibrium price to rise from $2.00 to $2.50 and the equilibrium quantity to rise from 7 to 10 cones.
Price of Ice-Cream Cone
$2.50
1. Hot weather increases
the demand for ice cream . . .
Supply New equilibrium
Initial equilibrium
D2 D1
2. . . . resulting in a higher price . . .
0 7 10
Quantity of Ice-Cream Cones
3. . . . and a higher quantity sold.
“Supply” refers to the position of the supply curve, whereas the “quantity sup- plied” refers to the amount suppliers wish to sell. In this example, supply does not change because the weather does not alter firms’ desire to sell at any given price. In- stead, the hot weather alters consumers’ desire to buy at any given price and thereby shifts the demand curve. The increase in demand causes the equilibrium price to rise. When the price rises, the quantity supplied rises. This increase in quan- tity supplied is represented by the movement along the supply curve.
To summarize, a shift in the supply curve is called a “change in supply,” and a shift in the demand curve is called a “change in demand.” A movement along a fixed supply curve is called a “change in the quantity supplied,” and a movement along a fixed demand curve is called a “change in the quantity demanded.”
Example: A Change in Supply Suppose that, during another summer, an earthquake destroys several ice-cream factories. How does this event affect the market for ice cream? Once again, to answer this question, we follow our three steps.
1. The earthquake affects the supply curve. By reducing the number of sellers, the earthquake changes the amount of ice cream that firms produce and sell at any given price. The demand curve is unchanged because the earthquake does not directly change the amount of ice cream households wish to buy.
2. The supply curve shifts to the left because, at every price, the total amount that firms are willing and able to sell is reduced. Figure 4-11 illustrates this decrease in supply as a shift in the supply curve from S1 to S2.
