
Page 86 - The Principle of Economics
P. 86
86 PART TWO SUPPLY AND DEMAND I: HOW MARKETS WORK
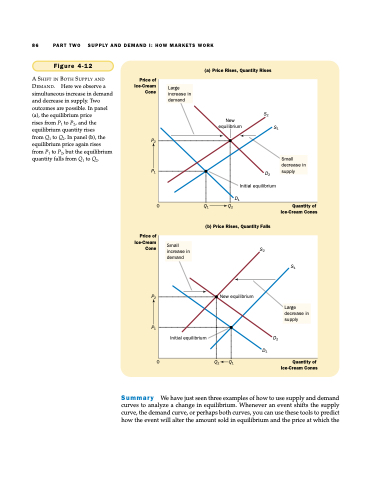
Figure 4-12
A SHIFT IN BOTH SUPPLY AND DEMAND. Here we observe a simultaneous increase in demand and decrease in supply. Two outcomes are possible. In panel (a), the equilibrium price
rises from P1 to P2, and the equilibrium quantity rises
from Q1 to Q2. In panel (b), the equilibrium price again rises from P1 to P2, but the equilibrium quantity falls from Q1 to Q2.
(a) Price Rises, Quantity Rises
Price of Ice-Cream Cone
P2
P1
Price of Ice-Cream Cone
P2
P1
0
Q1 Q2
(b) Price Rises, Quantity Falls
Quantity of Ice-Cream Cones
Large increase in demand
New equilibrium
S1
S2
D2 Initial equilibrium
D1
Small decrease in supply
Small increase in demand
S2
S1
New equilibrium
Large decrease in supply
D2 D1
Initial equilibrium
0
Q2 Q1
Quantity of Ice-Cream Cones
S u m m a r y We have just seen three examples of how to use supply and demand curves to analyze a change in equilibrium. Whenever an event shifts the supply curve, the demand curve, or perhaps both curves, you can use these tools to predict how the event will alter the amount sold in equilibrium and the price at which the
