
Page 87 - The Principle of Economics
P. 87
CHAPTER 4 THE MARKET FORCES OF SUPPLY AND DEMAND 87
IN THE NEWS
Mother Nature Shifts the Supply Curve
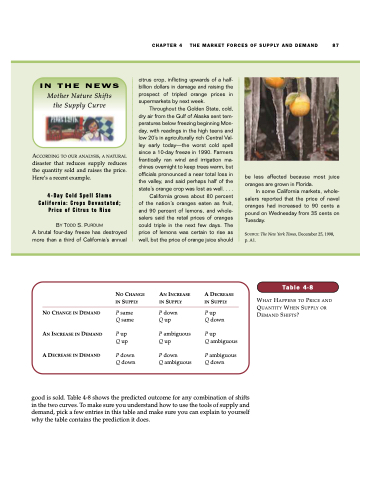
ACCORDING TO OUR ANALYSIS, A NATURAL disaster that reduces supply reduces the quantity sold and raises the price. Here’s a recent example.
4-Day Cold Spell Slams California: Crops Devastated; Price of Citrus to Rise
BY TODD S. PURDUM
A brutal four-day freeze has destroyed more than a third of California’s annual
citrus crop, inflicting upwards of a half- billion dollars in damage and raising the prospect of tripled orange prices in supermarkets by next week.
Throughout the Golden State, cold, dry air from the Gulf of Alaska sent tem- peratures below freezing beginning Mon- day, with readings in the high teens and low 20’s in agriculturally rich Central Val- ley early today—the worst cold spell since a 10-day freeze in 1990. Farmers frantically ran wind and irrigation ma- chines overnight to keep trees warm, but officials pronounced a near total loss in the valley, and said perhaps half of the state’s orange crop was lost as well. . . .
California grows about 80 percent of the nation’s oranges eaten as fruit, and 90 percent of lemons, and whole- salers said the retail prices of oranges could triple in the next few days. The price of lemons was certain to rise as well, but the price of orange juice should
be less affected because most juice oranges are grown in Florida.
In some California markets, whole- salers reported that the price of navel oranges had increased to 90 cents a pound on Wednesday from 35 cents on Tuesday.
SOURCE: The New York Times, December 25, 1998, p. A1.
NOCHANGEINDEMAND AN INCREASE IN DEMAND A DECREASE IN DEMAND
NO CHANGE
IN SUPPLY
Psame Q same
P up Q up
P down Q down
AN INCREASE
IN SUPPLY
Pdown Q up
P ambiguous Q up
P down
Q ambiguous
A DECREASE
IN SUPPLY
Pup
Q down
P up
Q ambiguous
P ambiguous Q down
Table 4-8
WHAT HAPPENS TO PRICE AND QUANTITY WHEN SUPPLY OR DEMAND SHIFTS?
good is sold. Table 4-8 shows the predicted outcome for any combination of shifts in the two curves. To make sure you understand how to use the tools of supply and demand, pick a few entries in this table and make sure you can explain to yourself why the table contains the prediction it does.
