
Page 31 - Listing Partners Pre Listing Offering
P. 31
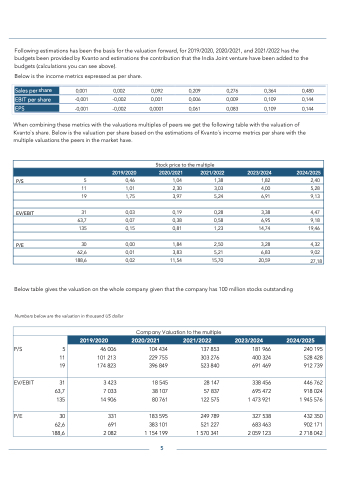
 Following estimations has been the basis for the valuation forward, for 2019/2020, 2020/2021, and 2021/2022 has the budgets been provided by Kvanto and estimations the contribution that the India Joint venture have been added to the budgets (calculations you can see above).
Below is the income metrics expressed as per share.
When combining these metrics with the valuations multiples of peers we get the following table with the valuation of Kvanto`s share. Below is the valuation per share based on the estimations of Kvanto´s income metrics per share with the multiple valuations the peers in the market have.
  Sales per share
       0,001 0,002 0,092 0,209 0,276 0,364 0,480 -0,001 -0,002 0,001 0,006 0,009 0,109 0,144
         EBIT per share
 EPS
-0,001 -0,002 0,0001 0,061 0,083 0,109 0,144
    Stock price to the multiple
 2019/2020 2020/2021 2021/2022 2023/2024 2024/2025
P/S
5 0,46 1,04 1,38 1,82 2,40
11 1,01 2,30 3,03 4,00 5,28
19 1,75 3,97 5,24 6,91 9,13
EV/EBIT
31 0,03 0,19 0,28 3,38 4,47
63,7 0,07 0,38 0,58 6,95 9,18
135 0,15 0,81 1,23 14,74 19,46
P/E
30 0,00 1,84 2,50 3,28 4,32
62,6 0,01 3,83 5,21 6,83 9,02
188,6 0,02 11,54 15,70 20,59
27,18
Below table gives the valuation on the whole company given that the company has 100 million stocks outstanding
Numbers below are the valuation in thousand US dollar
 Company Valuation to the multiple
P/S 5 11 19
 2019/2020 2020/2021 2021/2022 2023/2024 2024/2025
46 006 101 213 174 823
104 434 229 755 396 849
137 853 303 276 523 840
181 966 400 324 691 469
240 195 528 428 912 739
EV/EBIT 31 63,7 135
3 423
7 033 14 906
18 545 38 107 80 761
28 147
57 837 122 575
338 456
695 472 1 473 921
446 762
918 024 1 945 576
P/E 30 62,6 188,6
331
691 2 082
183 595
383 101 1 154 199
249 789
521 227 1 570 341
327 538
683 463 2 059 123
432 350
902 171 2 718 042
5
