
Page 25 - Sample Financial Plan 4-1-2019 v2
P. 25
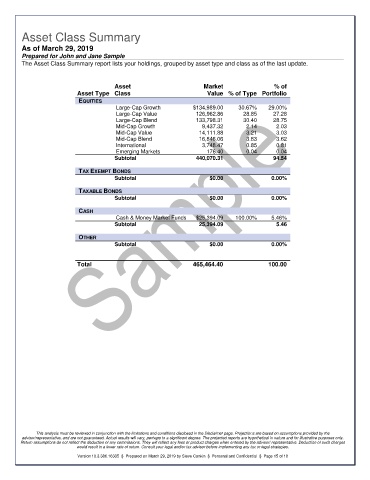
Asset Class Summary

        As of March 29, 2019
        Prepared for John and Jane Sample
        The Asset Class Summary report lists your holdings, grouped by asset type and class as of the last update.


                                       Asset                        Market                  % of
                           Asset Type  Class                          Value  % of Type  Portfolio
                           EQUITIES
                                       Large-Cap Growth          $134,989.00    30.67%    29.00%
                                       Large-Cap Value            126,962.86      28.85    27.28
                                       Large-Cap Blend            133,798.31      30.40    28.75
                                       Mid-Cap Growth               9,437.32       2.14     2.03
                                       Mid-Cap Value               14,111.88       3.21     3.03
                                       Mid-Cap Blend               16,846.06       3.83     3.62
                                       International                3,748.47       0.85     0.81
                                       Emerging Markets              176.40        0.04     0.04
                                       Subtotal                   440,070.31               94.54


                           TAX EXEMPT BONDS
                                       Subtotal                       $0.00                0.00%


                           TAXABLE BONDS
                                       Subtotal                       $0.00                0.00%


                           CASH
                                       Cash & Money Market Funds   $25,394.09   100.00%    5.46%
                                       Subtotal                    25,394.09                5.46


                           OTHER
                                       Subtotal                       $0.00                0.00%


                           Total                                 465,464.40               100.00


             This analysis must be reviewed in conjunction with the limitations and conditions disclosed in the Disclaimer page. Projections are based on assumptions provided by the
        advisor/representative, and are not guaranteed. Actual results will vary, perhaps to a significant degree. The projected reports are hypothetical in nature and for illustrative purposes only.
        Return assumptions do not reflect the deduction of any commissions. They will reflect any fees or product charges when entered by the advisor/ representative. Deduction of such charges
                          would result in a lower rate of return. Consult your legal and/or tax advisor before implementing any tax or legal strategies.

                           Version 10.3.386.16335  §  Prepared on March 29, 2019 by Steve Conkin  §  Personal and Confidential  §  Page 15 of 18