
Page 122 - Algebra
P. 122
6.4. Graphing Quadratic Equations
The graph of the quadratic equation f(x) = ax2 + bx + c = 0, where a ≠ 0 is a parabola.
• If a < 0, the graph opens upward.
• If a > 0, the graph opens downward.
−𝑏 −𝑏
• The maximum or the minimum point of the parabola is called the vertex. −𝑏
• The line of symmetry is x = 2𝑎
• The coordinates of the vertex are (2𝑎, f(2𝑎))
• When a > 0, a quadratic equation has a minimum value that occurs at x =
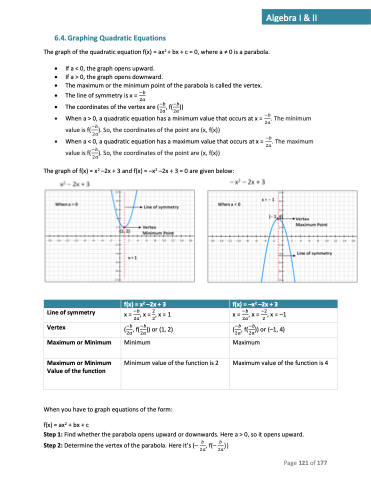
• When a < 0, a quadratic equation has a maximum value that occurs at x = The graph of f(x) = x2 –2x + 3 and f(x) = –x2 –2x + 3 = 0 are given below:
−𝑏
2𝑎. The minimum
−𝑏
value is f( 2𝑎). So, the coordinates of the point are (x, f(x))
−𝑏
2𝑎. The maximum
−𝑏
value is f( 2𝑎). So, the coordinates of the point are (x, f(x))
f(x)=x2 –2x+3
f(x)=–x2 –2x+3
Line of symmetry Vertex
Maximum or Minimum
−𝑏 2
x = 2𝑎, x = 2, x = 1
−𝑏 −𝑏
(2𝑎, f(2𝑎)) or (1, 2)
Minimum
−𝑏 −2
x = 2𝑎, x = 2 , x = –1
−𝑏 −𝑏
(2𝑎, f(2𝑎)) or (–1, 4)
Maximum
Maximum or Minimum Value of the function
Minimum value of the function is 2
Maximum value of the function is 4
When you have to graph equations of the form: f(x)=ax2 +bx+c
Step 1: Find whether the parabola opens upward or downwards. Here a > 0, so it opens upward.
Step 2: Determine the vertex of the parabola. Here it’s (– , f(– )) 2𝑎 2𝑎
𝑏𝑏
Page 121 of 177
Algebra I & II
