
Page 4 - Table Reading
P. 4
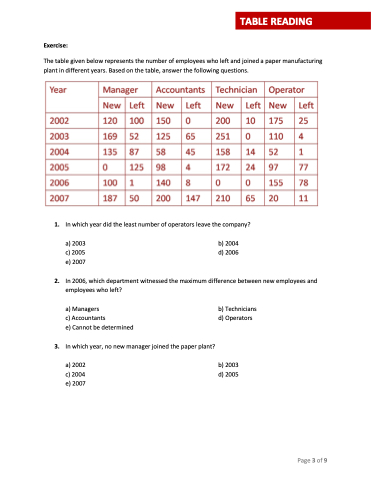
Exercise:
The table given below represents the number of employees who left and joined a paper manufacturing plant in different years. Based on the table, answer the following questions.
 1. In which year did the least number of operators leave the company?
a) 2003 b) 2004 c) 2005 d) 2006 e) 2007
2. In 2006, which department witnessed the maximum difference between new employees and employees who left?
a) Managers
c) Accountants
e) Cannot be determined
3. In which year, no new manager joined the paper plant?
a) 2002 c) 2004 e) 2007
b) Technicians d) Operators
b) 2003 d) 2005
Page 3 of 9
 TABLE READING
