
Page 643 - NGTU_paper_withoutVideo
P. 643
Modern Geomatics Technologies and Applications
Table 4 The overall accuracy and the kappa
index of each method
Method Overall Kappa
Accuracy index
C4.5 78.3 74.8
CART 75.6 71.4
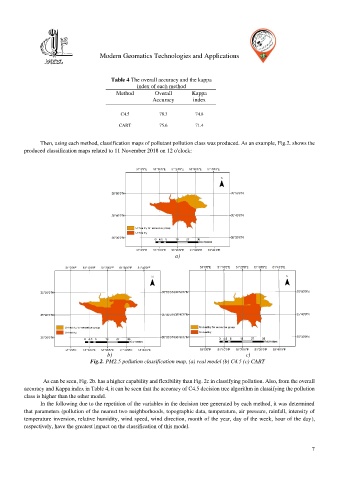
Then, using each method, classification maps of pollutant pollution class was produced. As an example, Fig.2. shows the
produced classification maps related to 11 November 2018 on 12 o'clock:
a)
b) c)
Fig.2. PM2.5 pollution classification map, (a) real model (b) C4.5 (c) CART
As can be seen, Fig. 2b. has a higher capability and flexibility than Fig. 2c in classifying pollution. Also, from the overall
accuracy and Kappa index in Table 4, it can be seen that the accuracy of C4.5 decision tree algorithm in classifying the pollution
class is higher than the other model.
In the following due to the repetition of the variables in the decision tree generated by each method, it was determined
that parameters (pollution of the nearest two neighborhoods, topographic data, temperature, air pressure, rainfall, intensity of
temperature inversion, relative humidity, wind speed, wind direction, month of the year, day of the week, hour of the day),
respectively, have the greatest impact on the classification of this model.
7