
Page 60 - NIB Annual Report 12-13 | 13-14
P. 60
TURKS AND CAICOS ISLANDS NATIONAL INSURANCE BOARD
Notes to Financial Statements, continued Year ended March 31, 2013
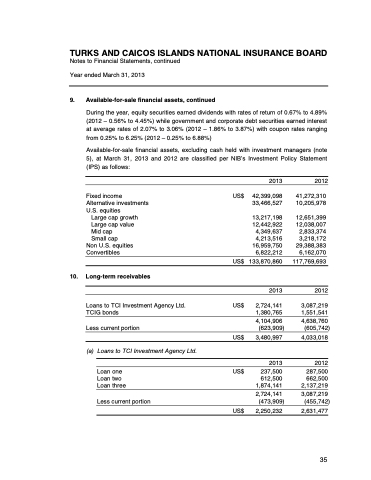
9. Available-for-sale financial assets, continued
During the year, equity securities earned dividends with rates of return of 0.67% to 4.89% (2012 – 0.56% to 4.45%) while government and corporate debt securities earned interest at average rates of 2.07% to 3.06% (2012 – 1.86% to 3.87%) with coupon rates ranging from 0.25% to 6.25% (2012 – 0.25% to 6.88%)
Available-for-sale financial assets, excluding cash held with investment managers (note 5), at March 31, 2013 and 2012 are classified per NIB’s Investment Policy Statement (IPS) as follows:
Fixed income Alternative investments U.S. equities
Large cap growth Large cap value Mid cap
Small cap
Non U.S. equities Convertibles
10. Long-term receivables
Loans to TCI Investment Agency Ltd. TCIG bonds
Less current portion
(a) Loans to TCI Investment Agency Ltd.
Loan one Loan two Loan three
Less current portion
US$
US$
US$ US$
US$
US$
2013
42,399,098 33,466,527
13,217,198 12,442,922 4,349,637 4,213,516 16,959,750 6,822,212
133,870,860
2013
2,724,141 1,380,765
4,104,906 (623,909)
3,480,997
2013
237,500
612,500 1,874,141
2,724,141 (473,909)
2,250,232
2012
41,272,310 10,205,978
12,651,399 12,038,007 2,833,374 3,218,172 29,388,383 6,162,070
117,769,693
2012
3,087,219 1,551,541
4,638,760 (605,742)
4,033,018
2012
287,500
662,500 2,137,219
3,087,219 (455,742)
2,631,477
56 | The National Insurance Board of The Turks and Caicos Islands
35
