
Page 22 - PCMI Summer Journal 2021
P. 22
The Chemistry and Control of Etching Ferrous Metals with Ferric Chloride Solutions: The Concept of a Constant Etchant Pool Presented by: David M. Allen, Emeritus Professor of Microengineering, Cranfield University, UK
°Bé also falls. Therefore, °Bé must be recorded at a specific temperature to be significant.
Table 1. The dependence of specific gravity and °Baumé on temperature.
FeCl3 solution
Specific gravity °Baumé
Specific gravity °Baumé
16°C 20°C
1.390 1.390 40.68 40.68 1.488 1.484 47.55 47.29
30°C 40°C
1.386 1.380 40.38 39.93 1.478 1.469 46.89 46.29
50°C
1.373 39.39 1.460 45.68
Etching kinetics and its dependence on ferric chloride concentration
The ferric ion needs to diffuse through the bulk solution and pass through a surface layer to react with the metal surface. After etching, the resultant ferrous ion then diffuses away from the surface so that fresh ferric ions can encounter the surface for the reaction to continue. The etching mechanism is therefore diffusion-controlled and the rate of diffusion is dependent on the viscosity of the ferric chloride.
For diffusion-controlled kinetics:
− d[M ] = ADC
dt S
where –d[M]/dt is the rate of dissolution of metal (mmol s-1), A is the surface area of metal
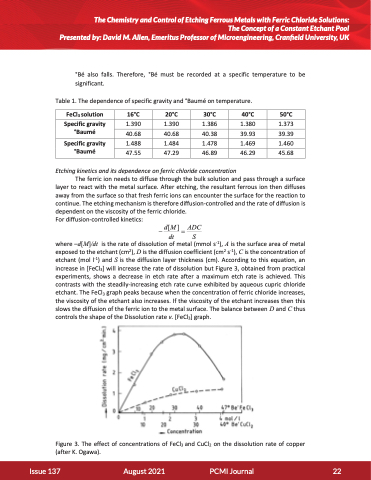
exposed to the etchant (cm2), D is the diffusion coefficient (cm2 s-1), C is the concentration of etchant (mol l-1) and S is the diffusion layer thickness (cm). According to this equation, an increase in [FeCl3] will increase the rate of dissolution but Figure 3, obtained from practical experiments, shows a decrease in etch rate after a maximum etch rate is achieved. This contrasts with the steadily-increasing etch rate curve exhibited by aqueous cupric chloride etchant. The FeCl3 graph peaks because when the concentration of ferric chloride increases, the viscosity of the etchant also increases. If the viscosity of the etchant increases then this slows the diffusion of the ferric ion to the metal surface. The balance between D and C thus controls the shape of the Dissolution rate v. [FeCl3] graph.
Figure 3. The effect of concentrations of FeCl3 and CuCl2 on the dissolution rate of copper (after K. Ogawa).
Issue 137 August 2021 PCMI Journal 22
