
Page 104 - Demo
P. 104
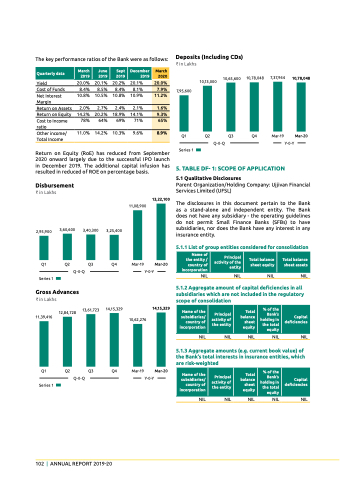
The key performance ratios of the Bank were as follows:
deposits (including cds)
        Quarterly data
March 2019
June 2019
sept 2019
december 2019
March 2020
   Yield
Cost of Funds Net Interest Margin
Return on Assets
Return on Equity
Cost to Income ratio
Other income/ Total Income
20.0%
8.4%
10.8%
2.0%
14.2%
78%
11.0%
20.1% 20.2% 20.1%
8.5% 8.4% 8.1%
10.5% 10.8% 10.9%
2.7% 2.4% 2.1%
20.2% 18.9% 14.1%
64% 69% 71%
14.2% 10.3% 9.6%
` in Lakhs
10,13,000
7,95,600
Q1 Series 1
10,65,600
Q3
10,78,048 7,37,944
Q4 Mar-19
10,78,048
Mar-20
20.0%
        7.9%
   11.2%
   1.6%
  9.3%
  65%
   2,95,900
3,40,300
Q3
3,25,400
Q4
14,15,329
Q4
8.9%
Q2
Q-0-Q
Y-0-Y
        Return on Equity (RoE) has reduced from September 2020 onward largely due to the successful IPO launch in December 2019. The additional capital infusion has resulted in reduced of ROE on percentage basis.
5. Table DF- 1: ScoPe oF aPPlicaTion
5.1 Qualitative disclosures
disbursement
` in Lakhs
3,60,600
13,22,100
Parent Organization/Holding Company: Ujjivan Financial Services Limited (UFSL)
The disclosures in this document pertain to the Bank as a stand-alone and independent entity. The Bank does not have any subsidiary - the operating guidelines do not permit Small Finance Banks (SFBs) to have subsidiaries, nor does the Bank have any interest in any insurance entity.
5.1.1 List of group entities considered for consolidation
NIL NIL NIL NIL
5.1.2 aggregate amount of capital deficiencies in all subsidiaries which are not included in the regulatory scope of consolidation
NIL NIL NIL NIL NIL
5.1.3 aggregate amounts (e.g. current book value) of the bank’s total interests in insurance entities, which are risk-weighted
NIL NIL NIL NIL NIL
11,08,900
       name of the entity / country of incorporation
 Principal activity of the entity
  total balance sheet equity
  total balance sheet assets
  Q1 Q2 Series 1
Q-0-Q
Mar-19 Mar-20 Y-0-Y
       gross advances
` in Lakhs
12,84,728 11,39,416
13,61,723
Q3
10,62,276
Mar-19
14,15,329
Mar-20
 name of the subsidiaries/ country of incorporation
 Principal activity of the entity
   total balance sheet equity
  % of the bank’s holding in the total equity
 capital deficiencies
           name of the subsidiaries/ country of incorporation
 Principal activity of the entity
   total balance sheet equity
  % of the bank’s holding in the total equity
 capital deficiencies
  Q1 Q2 Series 1
Q-0-Q
Y-0-Y
        102 | AnnuAl RepoRt 2019-20
