
Page 18 - Demo
P. 18
Core Strengths
Fundamentally resilient and growth focused
25%
of our Banking outlets are located in Unbanked Rural centres (URcs) and our ‘priority sector advances’ net of priority Sector Lending Certificates (PSLC) and
inter Bank participating Certificates (IBPC) were 75.02% of adjusted net bank credit (anBc).
WeLL capitaLiSed Bank
our capital adequacy ratio is 28.8% with Tier-I capital ratio being 28%. our liquidity coverage ratio (lCR) stood at 254% on March 31, 2020, and we are maintaining a high liquidity buffer to remain resilient. our portfolio quality is among the best in the industry. This is well articulated by the fact that our Net Non-performing Assets (NNPA) stood at a low 0.2% (vis-à-vis 0.3% in FY 2018-19) and provision coverage ratio at 80% in the reporting year.
incLUSive With deep maSS maRket inSiGht
We are an SFB, providing a
wide array of banking and financial services with focus on serving the financially unserved and underserved segments
of our country. We operate
144 banking outlets located in 79 districts classified by the RBI as under-banked districts as per the Census 2011.
Rich microfinance experience of our Promoter, UFSL, coupled with our ability to address mass market customer segments has allowed
us to emerge as one of India’s leading small finance banks in terms of deposits, branch count and geographic footprint.
Moreover, we undertake constant research on various segments within the mass market to understand the financing requirements of potential customers and accordingly, we customise and develop products and services to address their needs.
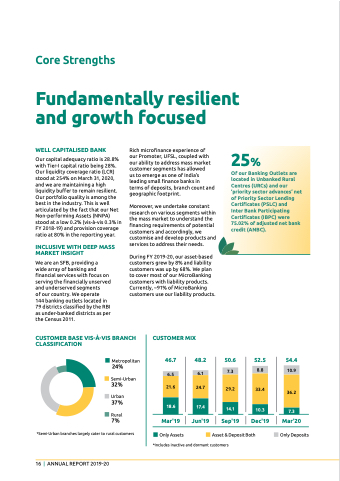
During FY 2019-20, our asset-based customers grew by 8% and liability customers was up by 68%. We plan to cover most of our MicroBanking customers with liability products. Currently, ~91% of MicroBanking customers use our liability products.
CUSTOMER BASE vIS-à-vIS BRANCH cLaSSiFication
Metropolitan
24%
Semi-Urban
32%
Urban
37%
Rural
7%
*Semi-Urban branches largely cater to rural customers
cUStomeR miX
46.7
6.1 21.6 24.7
48.2 50.6 52.5
54.4
10.9
36.2
mar'20
Only Deposits
6.5
7.3
8.8
29.2 33.4
18.6
mar'19
Only Assets
jun'19 Sep'19 dec'19
Asset & Deposit Both
*Includes inactive and dormant customers
17.4
14.1
10.3
7.3
16 | AnnuAl RepoRt 2019-20
