
Page 258 - Demo
P. 258
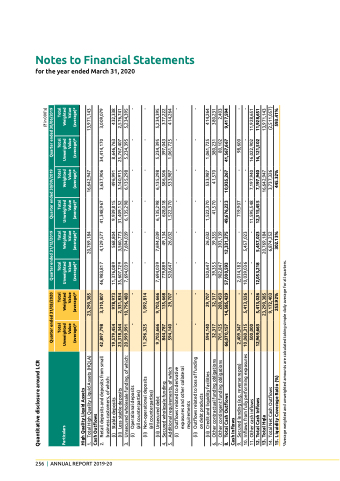
Notes to financial statements
for the year ended March 31, 2020
                                                                                                           256 | AnnuAl RepoRt 2019-20
Quantitative disclosure around LcR
Total Particulars unweighted
Total Weighted Value (average)*
Total Unweighted Value (average)*
Total Weighted Value (average)*
Total Unweighted Value (average)*
Total Weighted Value (average)*
Total Unweighted Value (average)*
Total Weighted Value (average)*
high quality Liquid Assets
1. total High Quality liquid Assets (HQlA)
23,290,385 3,310,807
20,769,184 4,129,577
16,642,947 3,637,906
13,971,143 3,009,079
Cash Outflows
2. Retail deposits and deposits from small business customers, of which:
(i) Stable deposits
(ii) less stable deposits
42,897,798
46,983,817
41,348,967
34,414,170
3. unsecured wholesale funding, of which: (i) operational deposits
19,579,454 23,318,344 20,999,991
978,973 2,331,834 10,796,480 -
11,376,089 35,607,729 7,694,039 -
568,804 3,560,773 7,694,039
9,939,815 31,409,152 6,135,298 -
496,991 3,140,915 6,135,298
8,646,763 25,767,407 5,234,395 -
432,338 2,576,741 5,234,395
(all counterparties)
(ii) non-operational deposits
1,092,814
-
-
-
-
-
-
(all counterparties) (iii) unsecured debt
9,703,666 844,787 594,140
9,703,666 135,668 29,707 -
7,694,039 779,889 520,647
7,694,039 49,134 26,032 -
6,135,298 628,018 1,522,370 -
6,135,298 586,506 533,987
5,234,395 397,043 1,061,725 -
5,234,395 377,222 414,264
4. Secured wholesale funding
5. Additional requirements, of which
(i) outflows related to derivative
-
-
-
-
exposures and other collateral
requirements
(ii) outflows related to loss of funding
-
-
-
-
-
-
-
-
on debt products
(iii) Credit and liquidity facilities
594,140 32,317 701,125 66,070,157
29,707
520,647 39,355 982,847 57,000,593
26,032
1,522,370 41,570 - 49,676,223
533,987 41,570 - 10,935,267
1,061,725 380,231 80,102 41,567,667
414,264 380,231 2,403 9,417,594
6. other contractual funding obligations
7. other contingent funding obligations
8. Total Cash Outflows
Cash Inflows
32,317 280,450 14,585,429
39,355 393,139 12,331,275
9. Secured lending (e.g. reverse repos)
10. Inflows from fully performing exposures 11. other cash inflows
12. Total Cash Inflows
13. Total hqla
14. total net Cash outflows
15. Liquidity Coverage Ratio (%)
2,409,347 10,060,315 500,000 12,969,663
- 5,413,026 - 5,413,026 23,290,385 9,172,403 253.92%
2,014,182 10,039,036 - 12,053,218
- 5,457,023 - 5,457,023 20,769,184 6,874,252 302.13%
719,907 - 11,595,548 12,315,455
-
98,600 - 16,022,902 16,121,502
-
*Average weighted and unweighted amounts are calculated taking simple daily average for all quarters.
quarter ended 31/03/2020
Quarter ended 31/12/2019
Quarter ended 30/09/2019
(` in 000's) Quarter ended 30/06/2019
Value (average)*
- 11,296,325
-
-
-
- 7,197,940 7,197,940 16,642,947 3,737,326 445.32%
- 11,928,651 11,928,651 13,971,143
(2,511,057)
593.41%
