
Page 259 - Demo
P. 259
Notes to financial statements
for the year ended March 31, 2020
FINANCIAL STATEMENTS
257
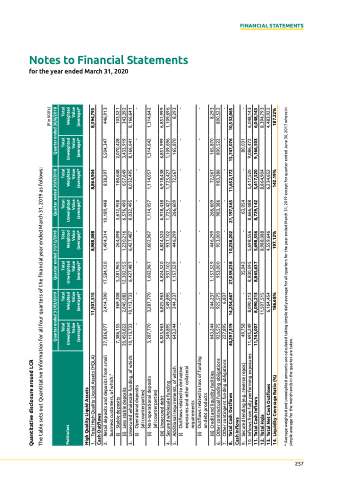
Quantitative disclosure around LcR
the table sets out Quantitative Information for all four quarters of the financial year ended March 31, 2019 as follows:
Total Particulars Unweighted
Total Weighted Value (average)*
Total Unweighted Value (average)*
Total Weighted Value (average)*
Total Unweighted Value (average)*
Total Weighted Value (average)*
Total Unweighted Value (average)*
Total Weighted Value (average)*
high quality Liquid Assets
1. total High Quality liquid Assets (HQlA)
11,507,515
8,988,088
8,864,904
8,394,793
Cash Outflows
2. Retail deposits and deposits from small business customers, of which:"
(i) Stable deposits
(ii) less stable deposits
27,836,977
2,414,390
17,584,120
1,494,314
10,189,448
838,297
5,504,347
446,913
3. unsecured wholesale funding, of which: (i) operational deposits
- 3,287,770
- 1,602,967
-
657,649 8,032,495 -
-
343,392 8,166,641 -
(all counterparties)
(ii) non-operational deposits
3,287,770
1,602,967
1,114,057
1,114,057
1,314,642
1,314,642
(all counterparties) (iii) unsecured debt
6,825,963 549,895 643,244
6,825,963 549,895 244,237
4,824,520 937,102 1,157,529 -
4,824,520 937,102 446,299
6,918,438 1,725,427 266,609 -
6,918,438 1,725,427 72,567 -
6,851,999 1,109,696 165,870 -
6,851,999 1,109,696 8,293 -
4. Secured wholesale funding
5. Additional requirements, of which
(i) outflows related to derivative
-
-
-
exposures and other collateral
requirements
(ii) outflows related to loss of funding
-
-
-
-
-
-
-
-
on debt products
(iii) Credit and liquidity facilities
643,244 925,575 227,895
244,237 925,575 6,837 14,254,667
1,157,529 953,000 - 27,059,238
446,299 953,000 - 10,258,202
266,609 983,386 - 21,197,365
72,567 983,386 - 11,652,172
165,870 800,522 - 15,747,076
8,293 800,522 - 10,532,065
6. other contractual funding obligations
7. other contingent funding obligations
8. Total Cash Outflows
Cash Inflows
40,297,319
9. Secured lending (e.g. reverse repos)
10. Inflows from fully performing exposures 11. Total Cash Inflows
12. Total hqla
13. Total Net Cash Outflows
14. Liquidity Coverage Ratio (%)
49,758 11,695,249 11,745,007
- 8,090,213 8,090,213 11,507,515 6,164,454 186.68%
35,042 8,830,595 8,865,637
- 5,698,556 5,698,556 8,988,088 4,559,646 197.12%
63,054 8,666,088 8,729,142
- 5,417,520 5,417,520 8,864,904 6,234,652 142.19%
80,031 9,086,472 9,166,503
- 6,048,143 6,048,143 8,394,793 4,483,922 187.22%
Quarter ended 31/03/2019
Quarter ended 31/12/2018
Quarter ended 30/9/2018
(` in 000's) Quarter ended 30/6/2018
Value (average)*
7,386,155 20,450,822 10,113,733
369,308 2,045,082 10,113,733 -
5,281,965 12,302,155 6,427,487 -
264,098 1,230,216 6,427,487
3,612,958 6,576,490 8,032,495
180,648
2,070,428 3,433,919 8,166,641
103,521
* Average weighted and unweighted amounts are calculated taking simple daily average for all quarters for the year ended March 31, 2019 except for quarter ended June 30, 2017 where in simple average for the month-ends in the quarter are taken.
