Page 494 - PERSIAN 1 1873_1879 Admin Report1_Neat
P. 494
126 ADMINISTRATION REPORT OP THE PERSIAN GULP POLITICAL RESIDENCY
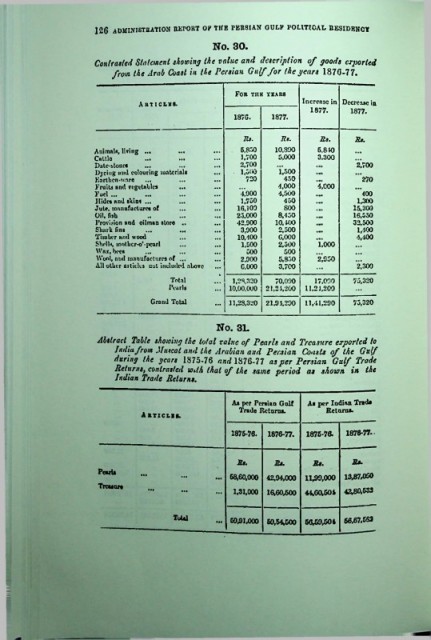
                                                 No. 30.
                      Contrasted Statement showing the value and description of goods exported
                          from the Arab Coast in the Persian Gulf for the years 1870-77.

                                                      For tux years
                                Articles.                            Increase in  Decrease in
                                                                      1877.    1877.
                                                     187G.    1877.

                                                       Rt.      It*.    Rt.     Rt.
                      Animnlfl, living ...             6,850   10,800   5,810
                      Cnltlo     ...     •••           1.700   5,000    3,300
                      Date-stones                      2.700                     2,700
                      Dyeing imd colouring materials   1,500   1,500
                      Earthen-ware                      720     450               270
                      Fruits and vegetables   eet              4.000    4, COO
                      Fuel ...                         4.900   4,500              400
                      Hides and skins ...              1.750    450              1,300
                      Jute, manufactures of           16,109    800             15.300
                      Oil. fish                       25,000   8,450            16,550
                      Provision and oilman storo ..   42.900   10.400           32,500
                      Shark fins         • M           3.900   2,500             1,100
                      Timber and wood                 10,400   G.000             4,400
                      Shells, mothcr-o’-pcarl          1,500   2,500    1,000
                      Wax, bees                         500      500
                       Wool, and manufactures of ...   2,900   5,850    2,950
                      All other articles cot included above  0,000  3.700        2,300
                                       Total         1,28,320  70,090  17,090   75,320
                                       Pearls       10,00,000  21,21,200  11,21,200
                                   Grand Total      11,23,320  21.91,290  11,41,290  75,320

                                                 No. 3L
                       Abstract Table showing the total value of Pearls and Treasure exported to
                           India from Muscat and the Arabian and Persian Coasts of the Gulf
                           during the years 1875-76 and 1876-77 as per Persian Gulf Trade
                           Returns, contrasted with that of the same period as shown in the
                           Indian Trade Returns.


                                                     As per Persian Gulf   As per Indian Trade
                                                      Trade Returns.      Returns.
                                 Articles.
                                                     1875-76.  1876-77.  1875-76.  1876-77.-


                                                      Rt.     Rt.      Rt.      Ms.
                       Pearls   • ••
                                                    68,60,000 42.94,000  11,99,000  13^7,050
                       Treasure
                                  • •t    • ••       1.31,000  16,60,500  44,60,504  47*80,633

                                        Total                                 66,67,653
                                                 Ml  694)1,000 59,54,500 6069,504

