
Page 10 - 2019 Apple Supply Chain Co-op, Inc. Annual Report
P. 10
Procurement
APPLE MARKET BASKET
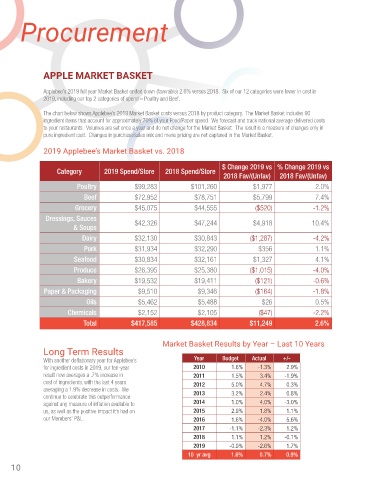
Applebee’s 2019 full year Market Basket ended down (favorable) 2.6% versus 2018. Six of our 12 categories were lower in cost in
2019, including our top 2 categories of spend – Poultry and Beef.
The chart below shows Applebee’s 2019 Market Basket costs versus 2018 by product category. The Market Basket includes 90
ingredient items that account for approximately 70% of your Food/Paper spend. We forecast and track national average delivered costs
to your restaurants. Volumes are set once a year and do not change for the Market Basket. The result is a measure of changes only in
pure ingredient cost. Changes in purchase/sales mix and menu pricing are not captured in the Market Basket.
2019 Applebee’s Market Basket vs. 2018
$ Change 2019 vs % Change 2019 vs
Category 2019 Spend/Store 2018 Spend/Store
2018 Fav/(Unfav) 2018 Fav/(Unfav)
Poultry $99,283 $101,260 $1,977 2.0%
Beef $72,952 $78,751 $5,799 7.4%
Grocery $45,075 $44,555 ($520) -1.2%
Dressings, Sauces
& Soups $42,326 $47,244 $4,918 10.4%
Dairy $32,130 $30,843 ($1,287) -4.2%
Pork $31,934 $32,290 $356 1.1%
Seafood $30,834 $32,161 $1,327 4.1%
Produce $26,395 $25,380 ($1,015) -4.0%
Bakery $19,532 $19,411 ($121) -0.6%
Paper & Packaging $9,510 $9,346 ($164) -1.8%
Oils $5,462 $5,488 $26 0.5%
Chemicals $2,152 $2,105 ($47) -2.2%
Total $417,585 $428,834 ($4 $11,249 2.6%
Market Basket Results by Year – Last 10 Years
Long Term Results
With another deflationary year for Applebee’s Year Budget Actual +/-
for ingredient costs in 2019, our ten-year 2010 1.6% -1.3% 2.9%
result now averages a .7% increase in 2011 1.5% 3.4% -1.9%
cost of ingredients, with the last 4 years 2012 5.0% 4.7% 0.3%
averaging a 1.9% decrease in costs. We 2013 3.2% 2.4% 0.8%
continue to celebrate this outperformance
against any measure of inflation available to 2014 1.0% 4.0% -3.0%
us, as well as the positive impact it’s had on 2015 2.9% 1.8% 1.1%
our Members’ P&L. 2016 1.6% -4.0% 5.6%
2017 -1.1% -2.3% 1.2%
2018 1.1% 1.2% -0.1%
2019 -0.9% -2.6% 1.7%
10 yr avg 1.6% 0.7% 0.9%
10