
Page 10 - 2019 Pancake Supply Chain Co-op, Inc. Annual Report
P. 10
Procurement
IHOP MARKET BASKET
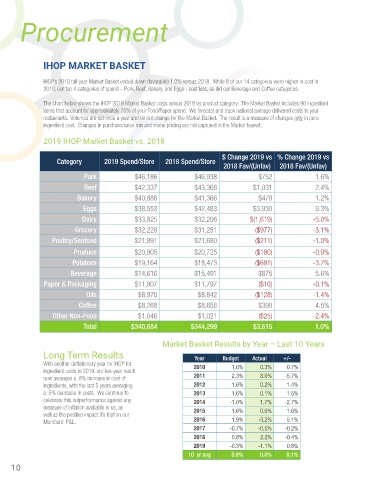
IHOP’s 2019 full year Market Basket ended down (favorable) 1.0% versus 2018. While 8 of our 14 categories were higher in cost in
2019, our top 4 categories of spend – Pork, Beef, Bakery, and Eggs - cost less, as did our Beverage and Coffee categories.
The chart below shows the IHOP 2019 Market Basket costs versus 2018 by product category. The Market Basket includes 90 ingredient
items that account for approximately 70% of your Food/Paper spend. We forecast and track national average delivered costs to your
restaurants. Volumes are set once a year and do not change for the Market Basket. The result is a measure of changes only in pure
ingredient cost. Changes in purchase/sales mix and menu pricing are not captured in the Market basket.
2019 IHOP Market Basket vs. 2018
$ Change 2019 vs % Change 2019 vs
Category 2019 Spend/Store 2018 Spend/Store
2018 Fav/(Unfav) 2018 Fav/(Unfav)
Pork $46,186 $46,938 $752 1.6%
Beef $42,337 $43,368 $1,031 2.4%
Bakery $40,888 $41,366 $478 1.2%
Eggs $38,553 $42,483 $3,930 9.3%
Dairy $33,825 $32,206 $(1,619) -5.0%
Grocery $32,228 $31,251 ($977) -3.1%
Poultry/Seafood $21,891 $21,680 ($211) -1.0%
Produce $20,905 $20,725 ($180) -0.9%
Potatoes $19,164 $18,473 ($691) -3.7%
Beverage $14,616 $15,491 $875 5.6%
Paper & Packaging $11,807 $11,797 ($10) -0.1%
Oils $8,970 $8,842 ($128) -1.4%
Coffee $8,268 $8,658 $390 4.5%
Other Non-Food $1,046 $1,021 ($25) -2.4%
Total $340,684 $344,299 $3,615 1.0%
Market Basket Results by Year – Last 10 Years
Long Term Results Year Budget Actual +/-
With another deflationary year for IHOP for 2010 1.0% 0.3% 0.7%
ingredient costs in 2019, our ten-year result
now averages a .8% increase in cost of 2011 2.3% 8.0% -5.7%
ingredients, with the last 5 years averaging 2012 1.6% 0.2% 1.4%
a .5% decrease in costs. We continue to 2013 1.6% 0.1% 1.5%
celebrate this outperformance against any 2014 -1.0% 1.7% -2.7%
measure of inflation available to us, as 2015 1.6% 0.0% 1.6%
well as the positive impact it’s had on our
Members’ P&L. 2016 1.9% -3.2% 5.1%
2017 -0.7% -0.5% -0.2%
2018 0.8% 2.2% -0.4%
2019 -0.3% -1.1% 0.8%
10 yr avg 0.9% 0.8% 0.1%
10