
Page 18 - Marketing Strategy 2025
P. 18
OngOIng marketIng bY tHe numbers
From in-person showings to weekly highlights in our Blue Bulletin and Monthly Newsletter,
we strive to ensure that your property receives as much visibility as possible during its time
on the market. database reaCH
Total Database Contacts: 77,000+ buyers, sellers, and investors in your system
We go beyond the baseline expectations of conventional real estate. When it comes to
finding new and innovative ways to market a property, we not only think outside the box – New Additions: 1,000+ new contacts quarterly
as far as we’re concerned there is no box.
Matchmaking Success Rate: 24% of properties sold through pre-market
We dig deep to find opportunities through unsurpassed creativity, hard work, and outreach to the database
team synergy.
• Public Open Houses • Local Patch and Community agent netWOrk reaCH
• Broker Tour and Luncheon Website Exposure
• Analysis of Buyer and Agent Feedback • Door Knockers for Neighborhood Local and Affiliate Agents Contacted: 40+ agents on The Vanderblue Team and a
• Local Vender Promotions Canvassing Leadership Team of 7
• Google Ads with SEO Optimization
• Digital Blog Posts Referral Successes: 14%+ of deals closed through agent partnerships or
• Buyer Database Targeting cross-network collaboration
dIgItal traffIC and engagement
Page Views: 206,374
Events Triggered by Users On-site: 775,751
Total Active Users: 68,008
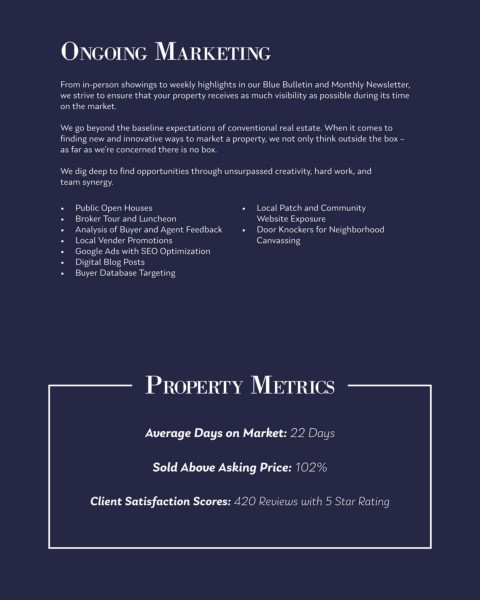
PrOPertY metrICs Lead Conversions: 2,600+ inquiries or registrations generated from website visits
Average Days on Market: 22 Days sOCIal medIa PresenCe
*Combined Facebook and Instagram Metrics
Sold Above Asking Price: 102% Impressions Across Platforms: 19,900+ impressions per year on platforms combined
Reaches Across Platforms: 140,000+ reaches per year on platforms combined
Client Satisfaction Scores: 420 Reviews with 5 Star Rating Engagement Rate: From total reach, 16% of users engaged with content through likes,
comments and shares