
Page 45 - Sector Alarm Annual Report 2020
P. 45
recognition.
Revenue from contracts with customers comprise of
2020
Point in time
2019
Point in time
0
33 308
74 016
123 517
5 512
236 353
2020
Sector Alarm / Annual Report 2020
The fair value of financial instruments that are not traded in an active market is determined using valuation methods. These methods use observable data where available. If all the essential data required to fix the fair value of an instrument is observable data, the instrument is included in level 2.
As of December 31, 2020, the Group has no financial assets or liabilities at level 1 or 3 that are measured at fair value in the balance sheet. The only instrument in level 2 is the interest derivative as specified in note 22. The same applies for 2019.
Note 4 / Important accounting estimates and judgmental items
Estimates and discretionary assessments are evaluated on an ongoing basis and are based on historical experience and other factors, including expectations of future events that are considered likely under current circumstances. The Group prepares estimates and makes assumptions related to the future. The accounting estimates that result from this will per definition rarely be fully consistent with the final outcome. Estimates and assumptions that represent a significant risk of material changes in the carrying amount of assets and liabilities during the next financial year are discussed below.
Impairment of goodwill, other intangible assets and contract cost
The Group’s recognised goodwill and other intangible assets are testet annually for impairment based on an estimation of value in use. See further details regarding impairment of goodwill and intangible assets in note 2.8 and note 7.
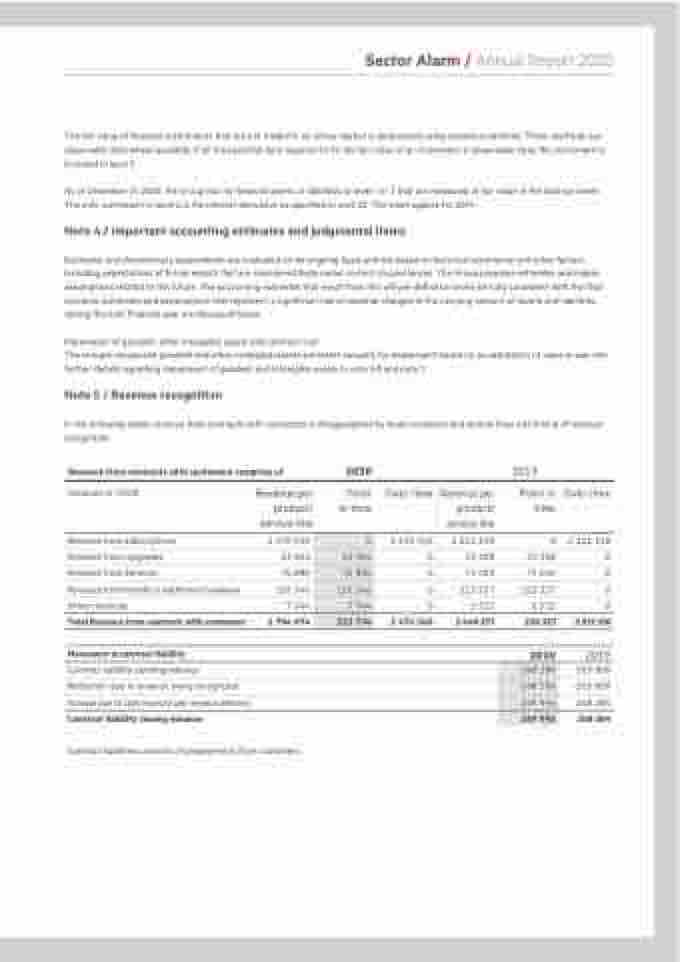
Note 5 / Revenue recognition
In the following tables revenue from contracts with customers is disaggregated by major products and service lines and timing of revenue
Amounts in TNOK
Revenue from subscriptions
Revenue from Upgrades
Revenue from Services
Revenue from Installs & additional hardware
Other revenues
Total Revenue from contracts with customers
Movement in contract liability
Contract liability opening balance
Reduction due to revenue being recognized
Increase due to cash received and revenue deferred
Contract liability closing balance
Revenue per product/ service line
2 470 340
23 564
75 880
126 346
7 944
2 704 074
Over time 2 470 340
0
0
0
0
2 470 340
Revenue per product/ service line 2 212 218
33 308
74 016
123 517
5 512
2 448 571
Over time
2 212 218
0
0
0
0
2 212 218
2019
265 808 -265 808 248 284 248 284
0
23 564
75 880
126 346
7 944
233 734
248 284
-248 284
249 996
249 996
Contract liabilities consists of prepayments from customers.
