
Page 24 - ANZCP Gazette MAY 2014
P. 24
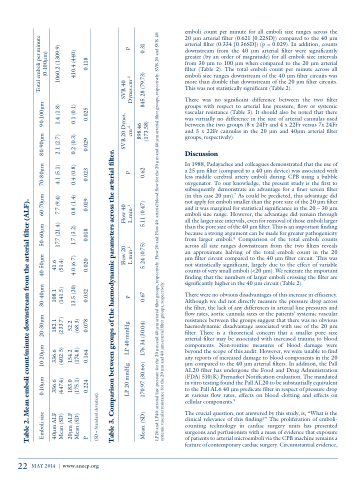
     emboli count per minute for all emboli size ranges across the 20 μm arterial filter (0.621 [0.22SD]) compared to the 40 μm arterial filter (0.334 [0.36SD]) (p = 0.029). In addition, counts downstream from the 40 μm arterial filter were significantly greater (by an order of magnitude) for all emboli size intervals from 30 μm to 100 μm when compared to the 20 μm arterial filter (Table 2). The total emboli count per minute across all emboli size ranges downstream of the 40 μm filter circuits was more than double that downstream of the 20 μm filter circuits. This was not statistically significant (Table 2).
There was no significant difference between the two filter groups with respect to arterial line pressure, flow or systemic vascular resistance (Table 3). It should also be noted that there was virtually no difference in the size of arterial cannulas used between the two groups (8 x 24Fr and 4 x 22Fr versus 7x 24Fr and 5 x 22Fr cannulas in the 20 μm and 40μm arterial filter groups, respectively).
Discussion
In 1988, Padayachee and colleagues demonstrated that the use of a 25 μm filter (compared to a 40 μm device) was associated with less middle cerebral artery emboli during CPB using a bubble oxygenator. To our knowledge, the present study is the first to subsequently demonstrate an advantage for a finer screen filter (in this case 20 μm).7 As could be predicted, this advantage did not apply for emboli smaller than the pore size of the 20 μm filter and it was marginal for statistical significance in the 20 – 30 μm emboli size range. However, the advantage did remain through all the larger size intervals, even for removal of those emboli larger than the pore size of the 40 μm filter. This is an important finding because a strong argument can be made for greater pathogenicity from larger emboli.8 Comparison of the total emboli counts across all size ranges downstream from the two filters reveals an approximate halving of the total emboli count in the 20 μm filter circuit compared to the 40 μm filter circuit. This was not statistically significant, largely due to the effect of variable counts of very small emboli (<20 μm). We reiterate the important finding that the numbers of larger emboli crossing the filter are significantly higher in the 40 μm circuit (Table 2).
There were no obvious disadvantages of this increase in efficiency. Although we did not directly measure the pressure drop across the filter, the lack of any differences in arterial line pressures and flow rates, aortic cannula sizes or the patients’ systemic vascular resistance between the groups suggest that there was no obvious haemodynamic disadvantage associated with use of the 20 μm filter. There is a theoretical concern that a smaller pore size arterial filter may be associated with increased trauma to blood components. Non-routine measures of blood damage were beyond the scope of this audit. However, we were unable to find any reports of increased damage to blood components in the 20 μm compared to the 40 μm arterial filters. In addition, the Pall AL20 filter has undergone the Food and Drug Administration (FDA) 510(K) Premarket Notification evaluation. The mandated in vitro testing found the Pall AL20 to be substantially equivalent to the Pall AL6 40 μm predicate filter in respect of pressure drop at various flow rates, effects on blood clotting and effects on cellular components.9
The crucial question, not answered by this study, is; “What is the clinical relevance of this finding?” The proliferation of emboli- counting technology in cardiac surgery units has presented surgeons and perfusionists with a mass of evidence that exposure of patients to arterial microemboli via the CPB machine remains a feature of contemporary cardiac surgery. Circumstantial evidence,
     22 MAY 2014 | www.anzcp.org
Table 2. Mean emboli count/minute downstream from the arterial filter (ALF).
Emboli size
0-10μm
10-20μm
20-30μm
30-40μm
40-50μm
50-60μm 17.7 (21.4)
60-70μm
70-80μm
80-90μm
90-100μm
Total emboli per minute (0-100μm)
40μm ALF Mean (SD)
356.6 (447.4)
336.6 (402.5)
182.1 (233.7)
108.1 (141.5)
41.6 (51.4)
7.7 (9.4)
4.1 (5.1)
2.1 (2.7)
1.4 (1.8)
1060.2 (1309.9)
20μm ALF Mean (SD)
183.0 (175.1)
154.2 (174.8)
52.2 (68.3)
13.5 (20) 0.032
4.0 (6.7) 0.020
1.7 (3.2) 0.018
0.8 (1.4) 0.019
0.4 (0.8) 0.023
0.2 (0.3) 0.029
0.1 (0.1) 0.025
410.4 (440) 0.118
P
(SD = Standard deviation).
0.164
0.078
0.224
Table 3. Comparison between groups of the haemodynamic parameters across the arterial filter.
LP 20 mmHg LP 40 mmHg p Flow 20 L.min-1
Flow 40 L.min-1
p SVR 20 Dynes. cm−5
SVR 40 Dynes.cm−5
p
Mean. (SD) 170.97 (30.66) 176.34 (30.04) 0.67 5.24 (0.75)
5.11 (0.47)
0.62 898.46 (173.58)
845.28 (79.73)
0.31
LP20 and LP40: arterial line pressure for the 20 μm and 40 μm arterial filter groups, respectively. Flow 20 and Flow 40: arterial blood flow for the 20 μm and 40 μm arterial filter groups, respectively. SVR 20 and SVR 40: systemic vascular resistance for the 20 μm and 40 μm arterial filter groups, respectively.
