
Page 12 - Custom Marketing Proposal for Your Residence
P. 12
THE KOENIGRUBLOFF REPORT
Monday October 26, 2015
CHICAGO, IL 60654
Condos - Townhomes
The median list price in CHICAGO, IL 60654 this week is $460,000. Real-Time Market Profile $ 460,000 Trend
Inventory is tightening and days-on-market is falling. The Market ±+
Action Index shows demand heating up. These are relatively bullish Median List Price $ 387 ±+
signs for prices. Asking Price Per Square Foot 136 ≠
Average Days on Market (DOM) 32 %
Supply and Demand Percent of Properties with Price Decrease ±+
Percent Relisted (reset DOM) 28 %
The market has shown some evidence of slowing recently. Both Percent Flip (price increased) 1%
prices and inventory levels are relatively unchanged in recent weeks. Median House Size (sq ft)
Watch the Market Action Index for changes as it can be a leading Median Number of Bedrooms 1248
indicator for price changes. Median Number of Bathrooms 2.0
2.0
Market Action Index Market Action Index Buyer's Advantage
28.7
±+ No change == Strong upward trend ≠≠ Strong downward trend
= Slight upward trend ≠ Slight downward trend
Price
We continue to see prices in this zip code bounce around this
plateau. Look for a persistent down-shift in the Market Action
Index before we see prices deviate from these levels.
Price Trends
7-Day Rolling Average 90-Day Rolling Average Buyer/Seller Cutoff
The Market Action Index answers the question "How's the
Market?" by measuring the current rate of sale versus the
amount of the inventory. Index above 30 implies Seller's
Market conditions. Below 30, conditions favor the buyer.
Quartiles 7-Day Rolling Average 90-Day Rolling Average
Quartile Median Price Square Feet Investigate the market in quartiles -
Top/First $ 1,100,000 2507 where each quartile is 25% of homes
Upper/Second ordered by price.
Lower/Third Beds Baths Age Inventory New Absorbed DOM
Bottom/Fourth
3.0 2.0 12 61 2 3 152 Most expensive 25% of properties
$ 537,450 1350 2.0 2.0 12 62 6 5 138 Upper-middle 25% of properties
$ 400,000 1070 2.0 1.5 13 62 1 8 169 Lower-middle 25% of properties Monday, October 26, 2015 THE Koenig
$ 267,000 725 1.0 1.0 15 62 5 8 85 Least expensive 25% of properties Condos & Townhomes
60610, 60611, 60654
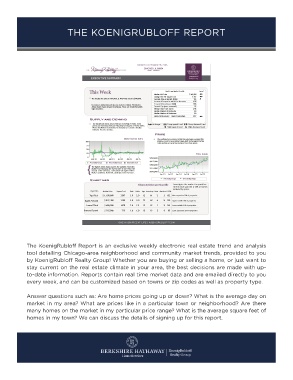
The KoenigRubloff Report is an exclusive weekly electronic real estate trend and analysis
tool detailing Chicago-area neighborhood and community market trends, provided to you
by KoenigRubloff Realty Group! Whether you are buying or selling a home, or just want to
stay current on the real estate climate in your area, the best decisions are made with up-
to-date information. Reports contain real time market data and are emailed directly to you
every week, and can be customized based on towns or zip codes as well as property type.
Answer questions such as: Are home prices going up or down? What is the average day on
market in my area? What are prices like in a particular town or neighborhood? Are there
many homes on the market in my particular price range? What is the average square feet of
homes in my town? We can discuss the details of signing up for this report.