
Page 34 - June-July 2025
P. 34
TRAILERTALK
Data-Driven Market Planning for Trailer
Dealers: NTDA End-Use Market Report
National Trailer Dealers Association Trailer The NTDA recently released an End-Use Market owns 50.6% of all basic enclosed van trailers — a significant
End-Use Market Data Report
Registration Counts for Road Tractors
by Trailer Type Most Often Towed/Attached, Data Report: Registration Counts for Road Tractors concentration that can help your targeted marketing efforts.
by Kind of Business, by State
by Trailer Type Most Often Towed/Attached by Kind
of Business, by State. The report is free to members State-Level Variations: A Strategic Advantage
as a benefit of NTDA membership. The report is National averages provide valuable benchmarks, but state-level data
available to non-members for $2,500. offers actionable insights for regional dealers. For example:
The survey utilizes data from the most recently published Vehicle • In North Carolina, 79.1% of trailers operated by the for-hire
Inventory and Use Survey (VIUS), conducted by the U.S. Census transportation sector are basic enclosed vans.
Bureau in collaboration with the Department of Transportation
(DOT). The report provides an invaluable dataset for trailer dealers • In contrast, Ohio shows only 37.3% in the same category.
and manufacturers. This comprehensive resource empowers industry Such variations underscore the importance of localized planning
stakeholders with insights into trailer type usage by business sector and suggest where specific trailer types may find stronger or weaker
and geography, facilitating more targeted market strategies and sales
resource allocation. demand.
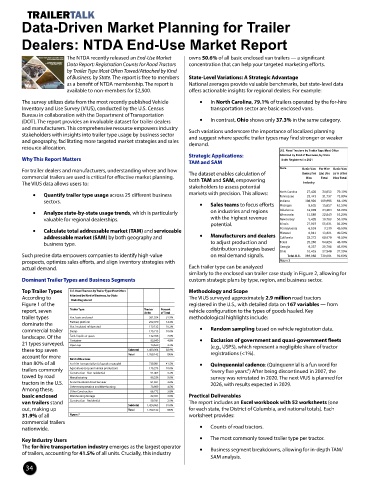
U.S. Road Tractors by Trailer Type Most Often
Strategic Applications: Attached by Kind of Business, by State
Why This Report Matters Units Registered in 2021
TAM and SAM
For trailer dealers and manufacturers, understanding where and how The dataset enables calculation of State Basic Van For Hire Basic Van
Owned for End Use as % of for
commercial trailers are used is critical for effective market planning. both TAM and SAM, empowering Hire Total Hire Total
The VIUS data allows users to: Industry
stakeholders to assess potential
• Quantify trailer type usage across 25 different business markets with precision. This allows: North Carolina 27,428 34,653 79.10%
Tennessee
31,737
73.90%
23,443
sectors. • Sales teams to focus efforts Indiana 108,920 169,995 64.10%
9,635
15,657
Michigan
61.50%
• Analyze state-by-state usage trends, which is particularly on industries and regions Oklahoma 12,909 24,264 53.20%
Wisconsin
51.20%
11,588
22,643
valuable for regional dealerships. with the highest revenue New Jersey 5,428 10,783 50.30%
potential. Illinois 27,907 55,631 50.20%
3,133
• Calculate total addressable market (TAM) and serviceable Pennsylvania 6,503 13,821 49.50%
49.50%
Missouri
6,841
addressable market (SAM) by both geography and • Manufacturers and dealers California 33,272 68,670 48.50%
business type. to adjust production and Texas 25,265 54,624 46.30%
9,357
distribution strategies based Georgia 10,415 20,798 45.00%
Ohio
27,946
37.30%
Such precise data empowers companies to identify high-value on real demand signals. Total U.S. 369,082 730,081 50.60%
prospects, optimize sales efforts, and align inventory strategies with Figure 2
actual demand. Each trailer type can be analyzed
similarly to the enclosed van trailer case study in Figure 2, allowing for
Dominant Trailer Types and Business Segments custom strategic plans by type, region, and business sector.
Top Trailer Types U.S. Road Tractors by Trailer Type Most Often Methodology and Scope
According to Attached by Kind of Business, by State The VIUS surveyed approximately 2.9 million road tractors
Units Registered
Figure 1 of the registered in the U.S., with detailed data on 167 variables — from
report, seven Trailer Type Tractor Percent vehicle configuration to the types of goods hauled. Key
of Total
Units
trailer types Van, basic enclosed 561,554 31.9% methodological highlights include:
dominate the Flatbed, platform 252,079 14.3%
10.2%
Van, insulated refrigerated
179,132
commercial trailer Dump 175,713 10.0% • Random sampling based on vehicle registration data.
landscape. Of the Tank, liquids or gases 132,948 7.6% • Exclusion of government and quasi-government fleets
21 types surveyed, Container 83,840 4.8%
74,639
4.2%
Open top
these top seven Subtotal 1,460,004 82.9% (e.g., USPS), which represent a negligible share of tractor
registrations (<1%).
account for more Kind of Business Total 1,760,142 100%
than 80% of all For-hire Transportation (of goods or people) 730,081 41.5% • Quinquennial cadence: (Quinquennial is a fun word for
trailers commonly Agriculture (crop and animal production) 175,275 10.0% “every five years.”) After being discontinued in 2007, the
5.2%
91,407
Construction - Non-residential
towed by road Manufacturing 88,236 5.0% survey was reinstated in 2020. The next VIUS is planned for
tractors in the U.S. Accommodation Food Services 81,031 4.6% 2026, with results expected in 2029.
Among these, Other transportation and Warehousing 78,980 4.5%
66,772
Other Construction
3.8%
basic enclosed Warehousing Storage 62,391 3.5% Practical Deliverables
2.9%
50,781
van trailers stand Construction - Residential Subtotal 1,424,963 81.0% The report includes an Excel workbook with 52 worksheets (one
out, making up Total 1,760,142 100% for each state, the District of Columbia, and national totals). Each
31.9% of all Figure 1 worksheet provides:
commercial trailers
nationwide. • Counts of road tractors.
Key Industry Users • The most commonly towed trailer type per tractor.
The for-hire transportation industry emerges as the largest operator • Business segment breakdowns, allowing for in-depth TAM/
of trailers, accounting for 41.5% of all units. Crucially, this industry
SAM analysis.
34