
Page 16 - NTDA Market Outlook Q1 2024
P. 16
www.ntda.org
16
U.S. Economic Snapshot
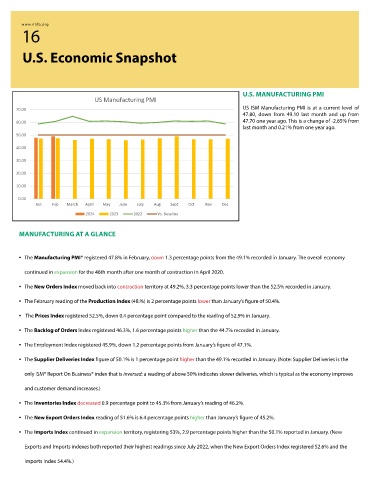
U.S. MANUFACTURING PMI
US Manufacturing PMI
70.00 US ISM Manufacturing PMI is at a current level of
47.80, down from 49.10 last month and up from
60.00 47.70 one year ago. This is a change of -2.65% from
last month and 0.21% from one year ago.
50.00
40.00
30.00
20.00
10.00
0.00
Jan Feb March April May June July Aug Sept Oct Nov Dec
2024 2023 2022 Vs. Baseline
MANUFACTURING AT A GLANCE
• The Manufacturing PMI® registered 47.8% in February, down 1.3 percentage points from the 49.1% recorded in January. The overall economy
continued in expansion for the 46th month after one month of contraction in April 2020.
• The New Orders Index moved back into contraction territory at 49.2%, 3.3 percentage points lower than the 52.5% recorded in January.
• The February reading of the Production Index (48.%) is 2 percentage points lower than January’s figure of 50.4%.
• The Prices Index registered 52.5%, down 0.4 percentage point compared to the reading of 52.9% in January.
• The Backlog of Orders Index registered 46.3%, 1.6 percentage points higher than the 44.7% recorded in January.
• The Employment Index registered 45.9%, down 1.2 percentage points from January’s figure of 47.1%.
• The Supplier Deliveries Index figure of 50.1% is 1 percentage point higher than the 49.1% recorded in January. (Note: Supplier Deliveries is the
only ISM® Report On Business® index that is inversed; a reading of above 50% indicates slower deliveries, which is typical as the economy improves
and customer demand increases.)
• The Inventories Index decreased 0.9 percentage point to 45.3% from January’s reading of 46.2%.
• The New Export Orders Index reading of 51.6% is 6.4 percentage points higher than January’s figure of 45.2%.
• The Imports Index continued in expansion territory, registering 53%, 2.9 percentage points higher than the 50.1% reported in January. (New
Exports and Imports indexes both reported their highest readings since July 2022, when the New Export Orders Index registered 52.6% and the
Imports Index 54.4%.)