
Page 22 - Market Outlook Q2 2024
P. 22
www.ntda.org
22
U.S. Economic Snapshot
U.S. ALUMINUM AND NONFERROUS
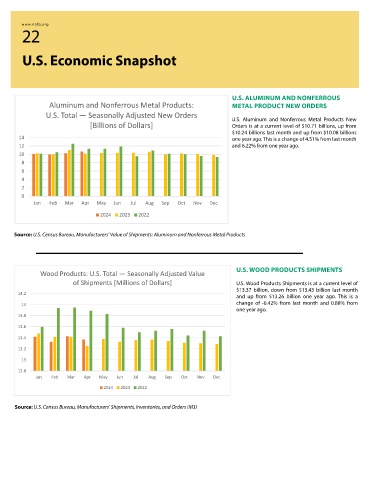
Aluminum and Nonferrous Metal Products: METAL PRODUCT NEW ORDERS
U.S. Total — Seasonally Adjusted New Orders U.S. Aluminum and Nonferrous Metal Products New
[Billions of Dollars] Orders is at a current level of $10.71 billions, up from
$10.24 billions last month and up from $10.08 billions
14 one year ago. This is a change of 4.51% from last month
12 and 6.22% from one year ago.
10
8
6
4
2
0
Jan Feb Mar Apr May Jun Jul Aug Sep Oct Nov Dec
2024 2023 2022
Source: U.S. Census Bureau, Manufacturers' Value of Shipments: Aluminum and Nonferrous Metal Products
Wood Products: U.S. Total — Seasonally Adjusted Value U.S. WOOD PRODUCTS SHIPMENTS
of Shipments [Millions of Dollars] U.S. Wood Products Shipments is at a current level of
$13.37 billion, down from $13.43 billion last month
14.2
and up from $13.26 billion one year ago. This is a
14 change of -0.42% from last month and 0.88% from
one year ago.
13.8
13.6
13.4
13.2
13
12.8
Jan Feb Mar Apr May Jun Jul Aug Sep Oct Nov Dec
2024 2023 2022
Source: U.S. Census Bureau, Manufacturers’ Shipments, Inventories, and Orders (M3)