
Page 12 - Market Outlook Q4 2024
P. 12
www.ntda.org
12
U.S. Economic Snapshot
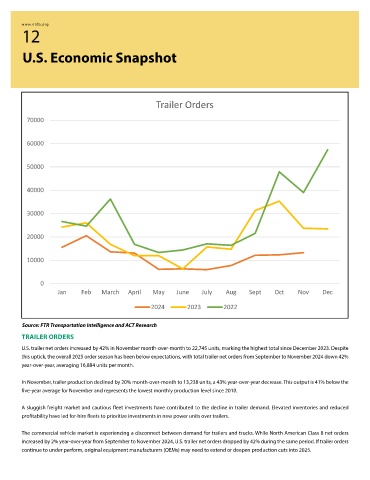
Trailer Orders
70000
60000
50000
40000
30000
20000
10000
0
Jan Feb March April May June July Aug Sept Oct Nov Dec
2024 2023 2022
Source: FTR Transportation Intelligence and ACT Research
TRAILER ORDERS
U.S. trailer net orders increased by 42% in November month-over-month to 22,745 units, marking the highest total since December 2023. Despite
this uptick, the overall 2025 order season has been below expectations, with total trailer net orders from September to November 2024 down 42%
year-over-year, averaging 16,884 units per month.
In November, trailer production declined by 20% month-over-month to 13,238 units, a 43% year-over-year decrease. This output is 41% below the
five-year average for November and represents the lowest monthly production level since 2010.
A sluggish freight market and cautious fleet investments have contributed to the decline in trailer demand. Elevated inventories and reduced
profitability have led for-hire fleets to prioritize investments in new power units over trailers.
The commercial vehicle market is experiencing a disconnect between demand for trailers and trucks. While North American Class 8 net orders
increased by 2% year-over-year from September to November 2024, U.S. trailer net orders dropped by 42% during the same period. If trailer orders
continue to under perform, original equipment manufacturers (OEMs) may need to extend or deepen production cuts into 2025.