Page 442 - Copper and Bronze in Art: Corrosion, Colorants, Getty Museum Conservation, By David Scott
P. 442

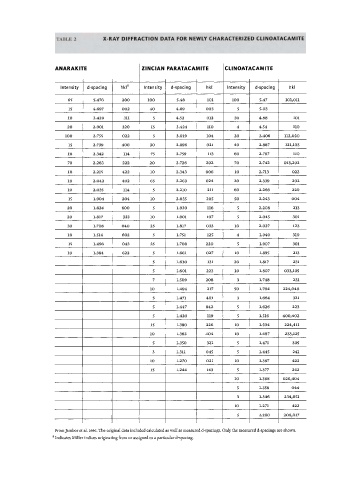
TABLE 2       X-RAY DIFFRACTION  DATA  FOR NEWLY CHARACTERIZED CLINOATACAMITE


            ANARAKI1 Έ                ZINCIAN  PARATACAI  MITE   CLINOATV  \CAMITE


              Intensity   d-spacing   hkl  a   Intensity   d-spacing   hkl   Intensity   d-spacing   hkl
                65      5.476   200     100      5.48     101    100     5.47    101,011
                15      4.697   002      40     4.69     003       5     5.03
                10      3.429    311      5     4.52      012     30     4.68       101
                20      2.901   220      15      3.424    110      4     4.54       110
               100      2.755   022       5      3.019    104     20     3.406   112,020
                15      2.739   400      30     2.896     021     40     2.887   121,103
                10      2.342    114     75      2.759    113     60     2.767      110
                70      2.263   222      20     2.726    202      70     2.742   013,202
                10      2.215   422      10     2.343    006      10     2.713     022
                10      2.042   402      65     2.263    024      20     2.339     202
                10      2.035    114     5      2.210     211     60     2.266     220
                15      1.904   204      10     2.035     205     50     2.243     004
                20      1.824   600      5       1.930    116      5     2.208      213
                20      1.817    333     10      1.901    107      5     2.045     301
                30      1.708   040      25      1.817    033     10     2.027      123
                10      1.514   602      5       1.751    125      4     1.940     310
                15      1.496   043      35      1.708   220       5     1.907     301
                10      1.384   622      5       1.661    027     10     1.895      213
                                         5       1.630    131     20     1.817      231
                                         5       1.601    223     10     1.807   033,105
                                         7       1.509   208       3     1.748      231
                                         10      1.494    217     50     1.704   224,040
                                         5       1.471    401      3     1.664      321
                                         5       1.447   042       5     1.626     223
                                         5       1.420    119      5     1.516   400,402
                                         15      1.380   226      10     1.504   224,411
                                         10      1.362   404      10     1.487   233,125
                                         5       1.350    321      5     1.471     305
                                         3       1.311   045       5     1.445     241
                                         10      1.270    021     10     1.387     422
                                         15      1.244    143      5     1.377     242
                                                                  10     1.368   026,404
                                                                   5     1.356     044
                                                                   3     1.346   234,051
                                                                  10     1.271     422
                                                                   5     1.260   206,017

            From Jambor et al. 1996. The original data included calculated as well as measured d-spacings. Only the measured d-spacings are shown.
            Indicates Miller indices originating from or assigned to a particular d-spacing.
           a
   437   438   439   440   441   442   443   444   445   446   447