
Page 91 - Sustainability report 2018 Ratti Group
P. 91
7.2 Directly
generated and distributed economic value
The following table shows economic value directly generated by the Ratti Group and distributed to internal and external stakeholders.
amounts in EUR thousands
Other revenues and net income Financial income
Economic value distributed
Interest payable on loans and other forms of debt Dividends distributed
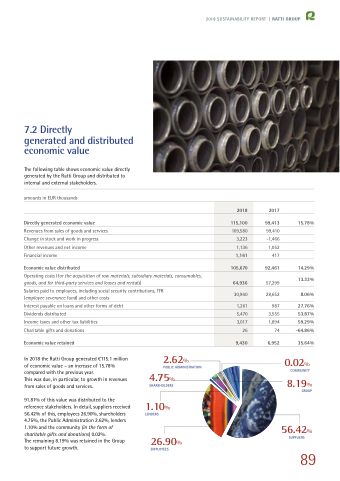
In 2018 the Ratti Group generated €115.1 million of economic value – an increase of 15.78% compared with the previous year.
This was due, in particular, to growth in revenues from sales of goods and services.
91.81% of this value was distributed to the reference stakeholders. In detail, suppliers received 56.42% of this, employees 26.90%, shareholders 4.75%, the Public Administration 2.62%, lenders 1.10% and the community (in the form of charitable gifts and donations) 0.02%.
The remaining 8.19% was retained in the Group to support future growth.
2017
99,413
99,410
-1,466
1,052
417
92,461
57,299 28,652
987 3,555 1,894 74
6,952
15.78%
14.29%
13.33%
8.06%
27.76% 53.87% 59.29%
-64.86% 35.64%
0.02%
COMMUNITY
8.19%
GROUP
56.42%
SUPPLIERS
2018 SUSTAINABILITY REPORT | RATTI GROUP
Directly generated economic value
Salaries paid to employees, including social security contributions, TFR (employee severance fund) and other costs
2018
115,100
Revenues from sales of goods and services
109,580
Change in stock and work in progress
3,223
1,136
1,161
105,670
Operating costs (for the acquisition of raw materials, subsidiary materials, consumables, goods, and for third-party services and leases and rentals)
64,936
30,960
1,261
Charitable gifts and donations
Economic value retained
5,470
Income taxes and other tax liabilities
3,017
9,430
26
2.62%
PUBLIC ADMINISTRATION
4.75%
SHAREHOLDERS
1.10%
LENDERS
26.90%
EMPLOYEES
89
