
Page 25 - The Black Range Naturalist Vol. 4, No. 3
P. 25
Vegetation Regeneration After Fire
Fire and the change which occurs after fire is of particular interest to us in the Black Range. Many of us have had the experience of watching the changes which have occurred following forest fires while walking the trails of the Black Range. Those changes have not only been of interest from a natural history perspective but they have also affected our “natural history experience”: “Let’s not walk the Sawyer’s Peak Trail today because the wind will be high and there are still a lot of standing snags.” (They are prone to fall in high wind.)
The Black Range is a geographically complex area. At many a vantage point it is possible to look out over a series of ridges - ridges with different exposures (north, west, south, east); different relief profiles (steep, very steep); and different vegetation patterns. It is easy to imagine what effect all of that had during a fire, causing it to rage in one spot and go more slowly in another. (An issue of profound importance to firefighters.) Those differences mean that a fire will be much hotter, and have a greater effect on vegetation and animals, in some places than others. The changes caused by the Silver Fire varied significantly in the Black Range. We have been able to watch the regeneration of vegetation with great interest. Regeneration has not all been the same - or at least, has not occurred at the same rate - because it began from very different base points. Our perception of that change has been limited by the amount of time we have been able to spend in the mountains and our relative skill at discerning that change.
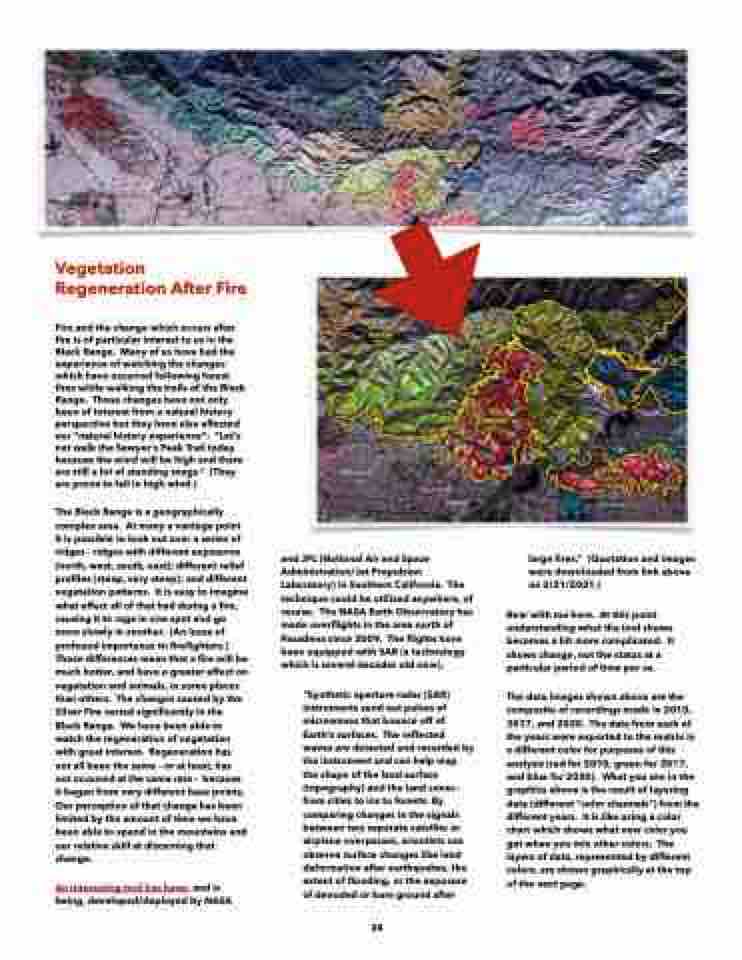
An interesting tool has been, and is being, developed/deployed by NASA
and JPL (National Air and Space Administration/Jet Propulsion Laboratory) in Southern California. The technique could be utilized anywhere, of course. The NASA Earth Observatory has made overflights in the area north of Pasadena since 2009. The flights have been equipped with SAR (a technology which is several decades old now).
“Synthetic aperture radar (SAR) instruments send out pulses of microwaves that bounce off of Earth’s surfaces. The reflected waves are detected and recorded by the instrument and can help map the shape of the land surface (topography) and the land cover— from cities to ice to forests. By comparing changes in the signals between two separate satellite or airplane overpasses, scientists can observe surface changes like land deformation after earthquakes, the extent of flooding, or the exposure of denuded or bare ground after
large fires.” (Quotation and images were downloaded from link above on 2/21/2021.)
Bear with me here. At this point understanding what the tool shows becomes a bit more complicated. It shows change, not the status at a particular period of time per se.
The data images shown above are the composite of recordings made in 2010, 2017, and 2020. The data from each of the years were exported to the matrix in a different color for purposes of this analysis (red for 2010, green for 2017, and blue for 2020). What you see in the graphics above is the result of layering data (different “color channels”) from the different years. It is like using a color chart which shows what new color you get when you mix other colors. The layers of data, represented by different colors, are shown graphically at the top of the next page.
24
