
Page 6 - Black Range Naturalist, Vol. 2, No. 4
P. 6
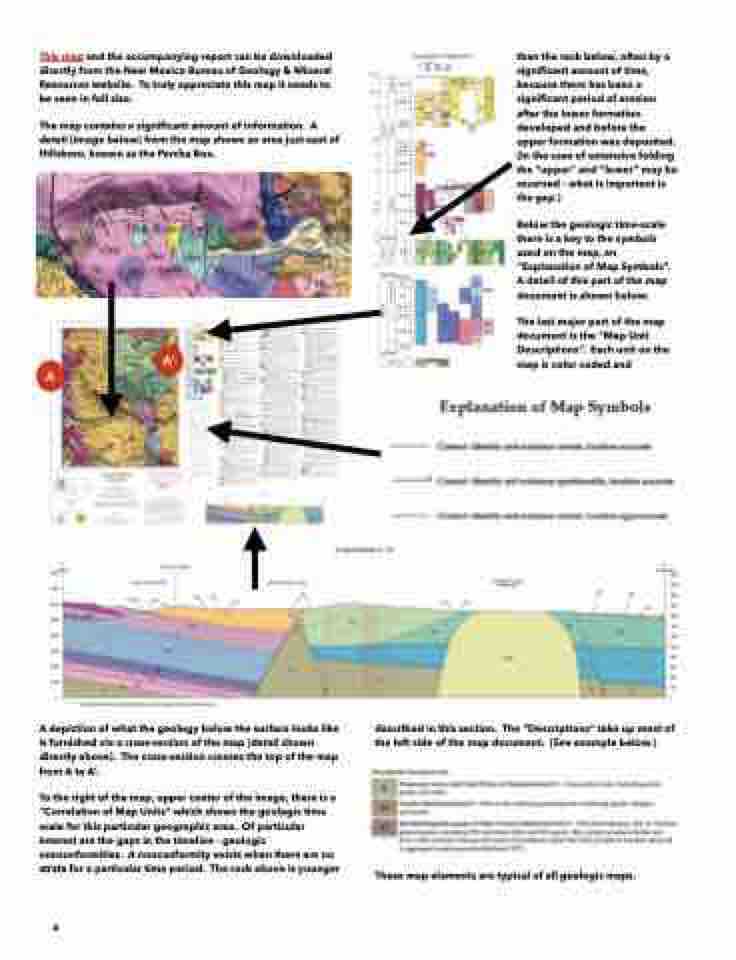
 This map and the accompanying report can be downloaded directly from the New Mexico Bureau of Geology & Mineral Resources website. To truly appreciate this map it needs to be seen in full size.
The map contains a significant amount of information. A detail (image below) from the map shows an area just east of Hillsboro, known as the Percha Box.
than the rock below, often by a significant amount of time, because there has been a significant period of erosion after the lower formation developed and before the upper formation was deposited. (In the case of extensive folding the “upper” and “lower” may be reversed - what is important is the gap.)
Below the geologic time-scale there is a key to the symbols used on the map, an “Explanation of Map Symbols”. A detail of this part of the map document is shown below.
The last major part of the map document is the “Map Unit Descriptions”. Each unit on the map is color coded and
         A
A’
    A depiction of what the geology below the surface looks like is furnished via a cross-section of the map (detail shown directly above). The cross-section crosses the top of the map from A to A’.
To the right of the map, upper center of the image, there is a “Correlation of Map Units” which shows the geologic time scale for this particular geographic area. Of particular interest are the gaps in the timeline - geologic nonconformities. A nonconformity exists when there are no strata for a particular time period. The rock above is younger
described in this section. The “Descriptions” take up most of the left side of the map document. (See example below.)
These map elements are typical of all geologic maps.
 4
