
Page 10 - GEORptMay19.pdf
P. 10
3.0 Macro Economy
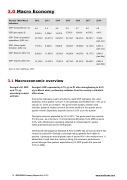
Georgia - Main Macro 2012 2013 2014 2015 2016 2017 2018* Indicators
GDP real growth (y/y, %)
6.4 3.4 4.6 2.9 2.7 5.0 4.8
GDP (per capita, $) 3,523.4 3,599.6 3,676.2 3,766.6 3,864.6 4,078.5 4,415
GDP: Final consumption expenditure, (GEL mn)
23,733.2 23,671.8 25,570.7 27,318.7 28,241.5 30,381.7 15,244 (Jan-Jun)
GDP: Gross capital formation, (GEL mn)
7,575.4 6,652.9 8,688.8 10,004.3 10,999.8 12,133.3 6,033.3 (Jan-Jun)
GDP: Exports, (GEL mn)
9,982.9 11,997.9 12,518.3 14,206.8 14,837.8 19,177.3 4,549.7 (Jan-Mar)
GDP: Imports, (GEL mn)
15,124.2 15,475.2 17,627.3 19,774.3 20,187.5 23,650.1 6,022.9 (Jan-Mar)
Source: bne IntelliNews, CEIC
3.1 Macroeconomic overview
Georgia’s Q1 GDP up 4.7% y/y according to rapid estimate
Georgia’s GDP expanded by 4.7% y/y in Q1 after strengthening to 6.0% y/y in March alone, preliminary estimates from the country’s statistical office show.
Among the indicators used to provide the rapid GDP estimates, the value added tax (VAT) payers’ turnover in Q1 gradually accelerated from 7.9% y/y in January to 12.6% y/y in March. The government budget, another used indicator, posted a surplus in two of the three months of the quarter and in quarter overall. Separately, exports rose by 12.8% y/y in the quarter.
Georgia’s economy expanded by 5% in 2017. The government also expects 5% this year, as a minimum. The International Monetary Fund (IMF) projects 4.6%, with infrastructure spending expected to compensate for weaker external demand and slower credit growth.
International rating agency Standard & Poor's (S&P) has announced that it has revised its outlook for Georgia’s sovereign rating upwards from stable to positive. It projects an annual growth rate of around 4% in the medium term. It added that it could raise the country’s rating if its economic performance proved stronger than present expectations (4% GDP growth this year and 3.5% in 2020).
10 GEORGIA Country Report May 2019 www.intellinews.com
