
Page 59 - RusRPTAug20
P. 59
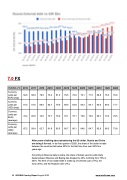
7.0 FX
RUSSIA -FX
2016
2017
2018
2Q18
3Q18
4Q18
1Q19
2Q19
3Q19
4Q19
1Q20
2Q20
Currency (units per EUR) (eop)
64.8
68.9
79.5
73.4
81.0
79.5
72.9
72.1
71.5
69.8
76.3
78.9
Currency (units per USD) (eop)
61.5
57.6
69.5
62.7
70.0
69.5
64.8
64.3
64.7
63.0
69.3
71.7
Currency (units per EUR) (average)
74.4
65.8
74.0
73.7
76.0
76.1
75.1
72.6
72.0
69.7
73.3
79.5
Currency (units per USD) (average)
67.2
58.4
62.7
61.8
65.5
66.7
66.1
64.6
64.7
62.9
66.5
73.8
After years of talking about abandoning the US dollar, Russia and China are doing it for real. In the first quarter of 2020, the share of the dollar in trade between the countries fell below 50% for the first time from over 90% four years ago.
According to Moscow daily Izvestia, the share of dollars used to settle trade deals between Moscow and Beijing has dropped to 46%, tumbling from 75% in 2018. The 54% of non-dollar trade is made up of Chinese yuan (17%), the euro (30%), and the Russian ruble (7%).
59 RUSSIA Country Report August 2020 www.intellinews.com
