
Page 61 - RusRPTAug20
P. 61
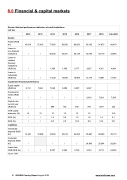
8.0 Financial & capital markets
Russia -Selected performance indicators of credit institutions (LC bn)
2012
2013
2014
2015
2016
2017
2018
Feb 2020
Assets
Assets (RUB bn)
49,510
57,423
77,653
83,000
80,063
85,192
91,973
96,418
Loans to non-financial institutions
/
/
29,536
33,301
30,135
30,193
43,110
33,840
Loans to resident financial institutions (RUB bn)
/
/
1,306
1,659
2,777
3,627
4,321
4,984
Loans to individuals (RUB bn)
/
/
11,330
10,684
10,804
12,174
14,901
17,787
Capital and financial performance
Equity capital (RUB bn)
6,113
7,064
7,928
9,009
9,387
9,397
Provision for losses (RUB bn)
/
/
/
/
/
6,916
7,624
7,396
Profit for the current year (RUB bn)
/
/
589
192
930
790
1279
223
CAR capital adequacy (%)
14
13
12
13
13
12
12.5
ROA (%)
/
/
1.0
0.0
1.0
1.0
1.4
2.1
ROE (%)
/
/
8.0
2.0
10.0
8.0
12.4
19.1
Liabilities
Individuals’ deposits (RUB bn)
14,251
16,958
18,553
23,219
24,200
25,987
28,460
30,174
Corporate deposits (RUB bn)
/
/
/
/
24,843
25,504
28,281
Loans from CBR (RUB bn)
/
/
9,287
5,363
2,726
2,016
2,710
2448.6
source: CBR
61 RUSSIA Country Report August 2020 www.intellinews.com
