
Page 33 - TURKRptSept19
P. 33
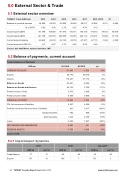
5.0 External Sector & Trade 5.1 External sector overview
TURKEY -Trade (USD mn)
2013
2014
2015
2016
2017
2018
Q1/19
H1
Balance on goods & services
-56,299
-36,918
-23,900
-25,629
-39,017
-16,260
-3,071
-8,094
(% of GDP)
-5.92
-3.95
-2.78
-2.97
-4.58
-2.12
-
-
Goods exports (BoP)
161,789
168,926
151,970
150,161
166,159
174,610
44,813
89,078
Goods imports (BoP)
241,706
232,519
200,098
191,053
225,114
216,479
47,884
97,172
Current account balance
-63,642
-43,610
-32,145
-33,139
-47,347
-27,115
-1,944
-3,259
Current account to GDP (%)
-6.7
-4.67
-3.74
-3.84
-5.56
-3.63
-
-
Source: bne IntelliNews, national statistics, IMF
5.2 Balance of payments, current account
Turkey's Balance of Payments USD mn
CURRENT ACCOUNT Exports
Imports
Balance on Goods
Balance on Goods and Services
Primary Income: Credit
Primary Income: Debit
FINANCIAL ACCOUNT
FDI: Net incurrence of liabilities
Portfolio Invesment: Net incurrence of liabilities
H1/2018
-31,049 85,776 119,467 -33,691 -25,123 2,975 9,099 -13,655 5,257 241 -782 1,023 -3,954 9,603 -7,759
H1/2019
y/y
-3,259
-90%
89,078
4%
97,172
-19%
-8,094
-76%
2,759
-111%
3,206
8%
9,490
4%
-1,764
-87%
4,598
-13%
3,617
1401%
858
-210%
2,759
170%
7,557
-291%
-161
-102%
-1,638
-79%
Equity Securities Debt Securities
Loans
NET ERRORS AND OMISSSIONS RESERVE ASSETS
source: tcmb
5.2.1 Import/export dynamics
2017
2018
Jan-Jul/19
USD bn
y/y (%)
USD bn
y/y (%)
USD bn
y/y (%)
Trade Balance
-77
37
-55
-28
-18
-62
Exports
157
10
168
7
99
3
33 TURKEY Country Report September 2019
www.intellinews.com
