
Page 58 - RusRPTAug19
P. 58
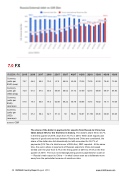
7.0 FX
RUSSIA -FX    2015   2016   2017   2018   2Q17   3Q17   4Q17   1Q18 2Q18 3Q18    4Q18 1Q19
Currency
(unitsper 79.7 64.8 68.9 79.5 67.5 68.04 69.26 EUR) (eop)
Currency
(unitsper 72.9 61.5 57.6 69.5 59.09 58.02 57.73 USD) (eop)
70.36 73.39 81.00
57.09 62.73 69.99
69.88 73.73 76.02
56.87 61.783 65.45
79.46 72.89
69.47 64.80
76.11 75.08
66.68 66.08
Currency (units per EUR) (average)
Currency (units per USD) (average)
source: CBR
67.8 74.4
61.9 67.2
65.8 74.0
58.4 62.7
62.88 69.22
57.14 59
68.78
58.41
The share of the dollar in payments for exports from Russia to China has fallen below 50% for the first time in history. The dollar’s share fell to 45.7% in the first quarter of 2019, down from 75.1% in 2018. When both exports and imports of goods and services between Russia and China are considered, the share of the dollar also fell dramatically but still accounted for 55.7% of payments ($14.7bn of a total turnover of $26.4bn), RBC reported. At the same time, the euro’s share in payments of Russian exports to China increased tenfold over the year from 0.7% in the first quarter of 2018 to 37.6% in the first quarter of 2019. The euro is increasingly being used in payments for crude oil — Russia’s main export to China — in what’s been seen as a deliberate move away from the petrodollar because of sanctions risks.
58 RUSSIA Country Report August 2019 www.intellinews.com
