
Page 60 - RusRPTAug19
P. 60
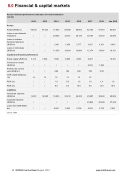
8.0 Financial & capital markets Russia -Selected performance indicators of credit institutions
(LC bn) Assets
2012
2013 2014 2015
57,423 77,653 83,000
/ 29,536 33,301 30,135 30,193
/ 1,306 1,659 2,777 3,627 / 11,330 10,684 10,804 12,174
Assets (RUB bn) 49,510
Loans to non-financial institutions /
Loans to resident
financial institutions
(RUB bn) /
Loans to individuals
(RUB bn) /
Capital and financial performance
80,063 85,192
Equity capital (RUB bn) 6,113 7,064 7,928 9,009 9,387 9,397
Provision for losses
(RUBbn) ///// 6,916
10,301 7,624
Profit for the current year (RUB bn)
CAR capital adequacy (%)
ROA (%)
ROE (%)
Liabilities
Individuals’ deposits (RUB bn)
/ / 589 192 930 790 14 13 12 13 13 12
1279
1.4 12.4
28,460 25,504 2,710
/ / / /
14,251 16,958
1.0 0.0 1.0 8.0 2.0 10.0
18,553 23,219 24,200
1.0 8.0
25,987 24,843 2,016
1.9 16.8
28,806 27,345 2,591
Corporate deposits
(RUBbn) / / / /
Loans from CBR (RUB
bn) / / 9,287 5,363
source: CBR
2,726
60 RUSSIA Country Report August 2019
www.intellinews.com
2016 2017
2018
91,973 33,372
4,321 14,901
Jun 2019
92,901 33,580
4,433 16,101
