
Page 17 - RUSRptAug18
P. 17
There are early signs that broader price pressures are beginning to build. Services inflation ticked up, while May’s Markit Services PMI underperformed, which shows that the recovery is still fragile.
“Inflation in non-food goods continued to rise – the latter may be a sign that the fall in the ruble in April may be having a lagged impact on inflation. Rosstat’s measure of core inflation, which also includes some food products, rose from 2.0% y/y to 2.3% y/y,” Capital Economics reports.
But the big unknown for the rest of the year will be how big an impact June’s VAT hike will be. Analysts are expecting inflation to climb back to around 4% by next year and also the CBR will slow its monetary easing in anticipation of the increased inflationary pressure from the tax hike.
“It was clear from last month’s central bank Board meeting that the VAT hike due to come in to force at the start of next year has limited the scope for monetary easing. Some of the trends seen in today’s data are likely to reinforce policymakers’ somewhat more hawkish shift,” Capital Economics said in a note. “However, this doesn’t rule out a resumption of the easing cycle – the headline rate is still very low (and may even fall further in July) and spare economic capacity will keep a lid on underlying price pressures. We still think the policy rate will be cut to 6.00% by early 2020, from 7.25% now.”
4.2.2 PPI dynamics
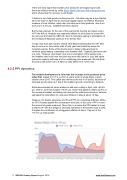
The notable development in June was the increase in the producer price index that spiked to 16.1% y/y from a years worth of single digits, a pace unseen since 2015. This uptick was driven by the rise in oil prices, as prices of oil-linked goods made up 11pp of the headline growth, according to bankers. .
Ruble-denominated oil prices started to add more visibly in April, with +45.4% y/y, while in June they surged +74.5% y/y. Given that gasoline makes up 4% of the consumer basket, and taking into account the retail price structure, bankers estimated the total effect on consumer inflation in May at about +0.5pp.
However, the basket structures of CPI and PPI are completely different. While, for CPI, Rosstat applies the consumption structure, in the case of PPI, it uses the amount of goods produced. Given this, in a sense the PPI basket is closer to that for IP, with the weight of oil-linked industries in the basket close to 28%. It implies the contribution of oil-triggered inflation at about 11pp out of the +16.1% y/y total growth.
17 RUSSIA Country Report August 2018 www.intellinews.com
