
Page 12 - IRANRptSep19
P. 12
prior to 2020 growth of 0.9%
IMF gauge course of Iran’s recession and sanctions-hit economy
Iran was thrown back into recession last year by the Trump administration’s decision to reapply sanctions, suffering an economic contraction of 1.9%, following 2016 growth of 13.4% (in the wake of the 2015 nuclear deal, which protected the country from heavy sanctions prior to the US change of policy in May 2018) and 2017 growth of 3.8%. The World Bank’s latest forecast is for Iranian GDP to contract 4.5% in 2019, but to grow 0.9% in 2020.
Iran’s annual inflation rate rose sharply from about 10% in mid-2018 to about 52% in April 2019, while the Iranian rial (IRR) on the unofficial parallel market sank more than twofold compared to levels prior to the announcement that US sanctions were on the way back, the World Bank noted.
“Growth in Iran is expected to resume in 2020-21, albeit at weak rates, as the impact of U.S. sanctions tapers and inflation stabilizes,” it added.
The International Monetary Fund (IMF) released their mid-year reports noting negative turns in forecast Iranian GDP growth.
The IMF said recession-hit Iran’s GDP was set to contract by as much as 6% in 2019 due to the heavy US sanctions that have squeezed the country’s economy since last year. The IMF also said that US sanctions on Iranian oil exports combined with record-high US crude oil production negatively affected the oil market and added “downward pressure on prices”.
The IMF’s report is more downbeat looking at the next two years, but sees modest growth in 2020 of 0.2%.
The IMF observed that Iran’s current account balance is expected to turn negative in 2019 and 2020 with declines of 0.4% and 0.6% year on year, respectively.
The Fund’s report also noted that general unemployment in Iran was expected to increase from 13.9% in 2018 to 15.4% and 16.1% in 2019 and 2020, respectively.
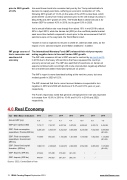
4.0 Real Economy
Iran - Main Macro Indicators
2012 2013 2014 2015 2016 2017 2018
Annual GDP (y/y)
-6.6 -1.9 4.3 4.4 13.4 3.8 -1.9
GDP (per capita) (USD)
7,719.77 7,931.07 6,007.46 5,579.25 4,899.68 5,230.19 5,494.06
GDP: Final consumption expenditure: Private (IRR bn)
3,208,428 4,505,167 5,262,427
5,656,000
6,236,000
7,032,000
3,899,000 (Q1-Q2)
GDP: Final consumption expenditure: Government (IRR bn)
713,990 868,334
1,160,266
1,301,000
1,700,000
1,952,000
1,134,000 (Q1-Q2)
GDP: Gross fixed capital formation, (IRR bn)
1,809,515 2,386,025 3,048,276
2,606,000
2,552,000
2,885,000
1,578,000 (Q1-Q2)
GDP: Exports, (lRR bn)
473,222 376,386 376,240 421,236 / /
GDP: Imports, (IRR bn)
449,701 345,821 281,210 265,210 / /
Source: CEIC; Central Bank of Iran
12 IRAN Country Report September 2019 www.intellinews.com
