
Page 27 - TURKRptDec19
P. 27
Government Consumption
9.5
5.0
6.6
4.9
9.5
6.9
5.3
6.6
3.4
7.0
Gross Fixed Capital Formation
2.2
8.2
-0.6
10.4
6.1
-4.4
-11.6
-12.1
-22.4
-12.6
Exports
-1.9
12.0
7.8
0.9
4.5
14.3
10.7
8.9
8.1
5.1
Imports (-)
3.7
10.3
-7.8
15.3
0.2
-16.3
-24.3
-29.4
-17.0
7.6
Current Prices (TRYbn)
GDP
2,609
3,11 1
3,724
790
890
1,027
1,017
922
1,024
1,145
By Production -Agriculture
7%
6%
6%
3%
4%
10%
6%
3%
5%
12%
Industry
22%
21%
22%
22%
22%
21%
24%
24%
23%
21%
Construction
10%
9%
7%
8%
8%
6%
6%
6%
5%
5%
Services
24%
22%
23%
23%
23%
24%
24%
23%
24%
24%
By Expenditure - Private Consumption
60%
59%
57%
58%
57%
55%
57%
56%
58%
57%
Government Consumption
15%
15%
15%
15%
15%
13%
17%
17%
16%
14%
Gross Fixed Capital Formation
29%
30%
30%
31%
33%
28%
29%
28%
26%
24%
Exports
22%
25%
30%
25%
27%
33%
32%
32%
33%
32%
Imports (-)
25%
29%
31%
32%
32%
30%
29%
31%
32%
28%
source: tuik
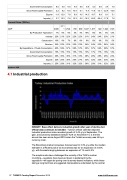
4.1 Industrial production
INSIGHT: Base effect delivers industrial growth after year of decline but official data continues to bewilder. Turkey’s official calendar-adjusted industrial production index recorded growth of 3.4% y/y in September. The gain, announced by statistical institute TUIK on November 14, is the first annual rise seen since August 2018 when the Turkish economy was hit by a currency crash.
The Bloomberg market consensus forecast was for 3.3% y/y while the median estimate in a Reuters poll of six economists was for an expansion of 3.55% y/y, with forecasts ranging between an expansion of 1% and 4.3%
The sceptics who have challenged the veracity of the TUIK’s number crunching—questions have been put down in parliament by the opposition—will again be poring over its survey-based indicators, while those taking a long hard look at suggested manipulations undertaken by the central
27 TURKEY Country Report December 2019 www.intellinews.com
