
Page 38 - RusRPTNov20
P. 38
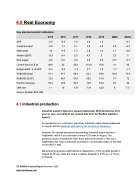
4.0 Real Economy
Key macroeconomic indicators
2015 2016 2017 2018 2019 2M20 2020e
GDP -2.5 -0.2 1.6 2.3 1.3 - -2.7
Industrial output -0.8 1.3 2.1 3.5 2.3 2.2 -6.3
Retail trade -10 -4.6 1.3 2.8 1.6 3.7 -3.8
Inflation (EOP) 12.9 5.4 2.5 4.3 3 2.3 5
Real wages -9.5 0.6 2.9 6.8 2.9 6.5* -6.7
Current account, $ bn 69.6 25 35.2 114.9 70.6 16 45
Budget deficit, % of GDP -2.5 -3.4 -1.4 2.7 1.8 -1.7 -1.7
RUB/USD (avg) 61.1 67.1 58.3 62.7 64.8 62.9 73.4
RUB/USD (EOP) 72.9 60.7 57.6 69.5 61.9 67 72
Brent $ / bbl (avg) 52.4 43.6 54.3 70.8 64.4 60 39
CBR rate 11 10 7.75 7.75 6.25 6 7.5 Source: Rosstat, BCS GM
4.1 Industrial production
Industrial output in Russia in January-September 2020 declined by 2.9% year on year, according to the revised data from the RosStat statistics agency.
As reported by bne IntelliNews, previously industrial output showed weakness in August, but the slowdown was seen by the analysts as temporary.
However, the revised data shows accelerating industrial output decline in September, with 5% y/y contraction versus 4.2% seen in August. The extraction sector remained the main driver behind the decline (-10% y/y in September) due to the continuous contraction in oil and gas output on the back of the OPEC+ deal.
Manufacturing posted a slight decline in September (-1.6% y/y) after growth in August (0.4% y/y), while the output in utilities dropped by 2.6% y/y (-2.1% y/y in August).
38 RUSSIA Country Report November 2020 www.intellinews.com
