
Page 36 - RusRPTMar20
P. 36
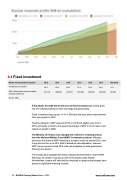
4.4 Fixed investment
Russia -Fixed capital investment 2012 2013 2014 2015 2016 2017 Mar-2018
Investment (% of GDP)
24.3 22.9 22.0 21.4 22.5 23.5 15.3
GDP: Gross fixed investment capital formation (USD mn)
471,337 496,982 428,573 276,240 280,350 342,294 58,303
source: CEIC
A key theme for 2020 will be the level of fixed investment as money goes into the national projects but here too things are going slowly.
Fixed investment was up just 1.4 % in 2019,but that was still an improvement from zero growth in 2018.
Fixed investment to GDP was just 20.5% in 2018 and slightly over 21% in 2019, but needs to climb to the government target of 25% if it is to make a real impact on growth in 2020.
The Ministry of Finance has changed the criteria for investing money from the National Welfare Fund (NWF) in domestic projects. Whereas previously the share of NWF financing in a project could not exceed 20%, now it may account for up to 40%. MinFin added an extra stipulation, however: NWF money cannot exceed 20% of all non-budgetary or state-guaranteed financing in a project.
The ministry also scrapped the widely-criticized demand that to receive NWF financing, an investor must put up 20% of the project costs himself. Nevertheless, experts still note that the emphasis on projects that already have access to significant financing remains.
36 RUSSIA Country Report March 2020 www.intellinews.com
