
Page 44 - RusRPTMar20
P. 44
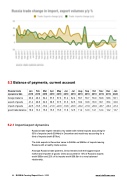
5.2 Balance of payments, current account
Russia trade dynamics $bn
Jan 2019
Feb 2019
Mar 2019
Apr 2019
May 2019
Jun 2019
Jul 2019
Aug 2019
Sep 2019
Oct 2019
Nov 2019
Dec 2019
Jan 2020
foreign trade t/o
63.9
46.3
52.4
57.5
57.6
51.4
52.4
55.7
55.7
55.9
59.8
58.6
56.1
export of goods
41.4
29.8
34.0
36.5
37.5
31.6
32.5
33.4
33.8
35.0
36.1
35.4
34.9
import of goods
-22.5
-16.5
-18.4
-21.0
-22.0
-19.8
-20.0
-22.2
-21.8
-20.9
-23.7
-23.2
-21.2
good trade balance
18.9
13.3
15.6
15.5
15.5
11.8
12.5
11.2
12.0
14.1
12.4
12.2
13.7
5.2.1 Import/export dynamics
Russia’s trade regime remains very stable with mineral exports accounting for 53% of exports (worth $244bn) in December and machinery accounting for a third of imports (worth $79bn).
The total exports in December came to $462bn vs $265bn of imports leaving Russia’s with a healthy trade surplus.
Amongst Russia’s trade partners, China remains both the biggest export market and importer of goods: China accounted for 13% of Russia’s exports worth $60bn and 22% of its imports worth $58.6bn in a very balanced relationship.
44 RUSSIA Country Report March 2020 www.intellinews.com
